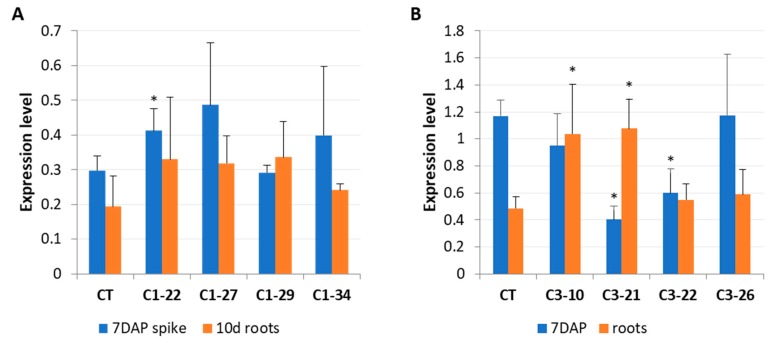
Figure 4.
Expression levels of wild-type HvCKX3 in ckx1 mutant lines (A) and wild-type HvCKX1 in ckx3 mutant lines (B). The transcript accumulation was analyzed in seven DAP spikes and 10-day-old roots. CT, control plants; values are mean ± SD (Tables S6 and S7); significantly different from control at * p < 0.05. The expression levels were calculated from three technical replicates according to the standard curve methods using the Elongation factor 2 gene as a normalizer. The analysis was performed for three biological replicates.

