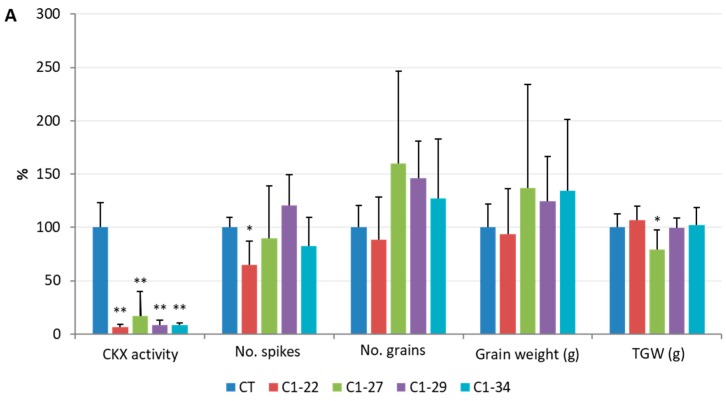
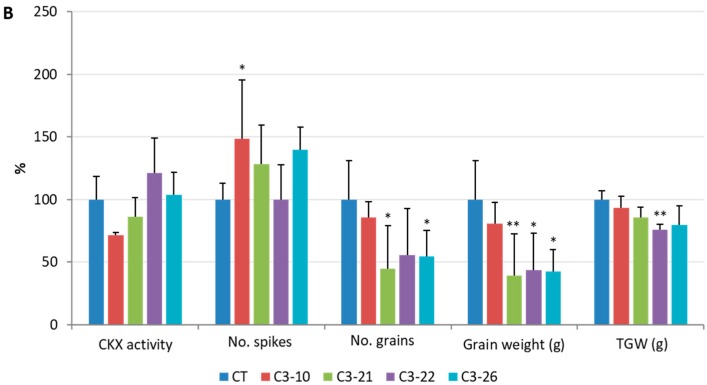
Figure 9.
Comparison of enzymatic CKX activity and select yield parameters of seven DAP spikes of ckx1 (A) and ckx3 (B) mutant lines. The data are presented as the percentage of the values in control plants (CT), which were set to 100%, the actual values are shown in Tables S10 and S11. The yield parameters were measured for three biological replicates, which were significantly different from the control at * p < 0.05, ** p < 0.01.


