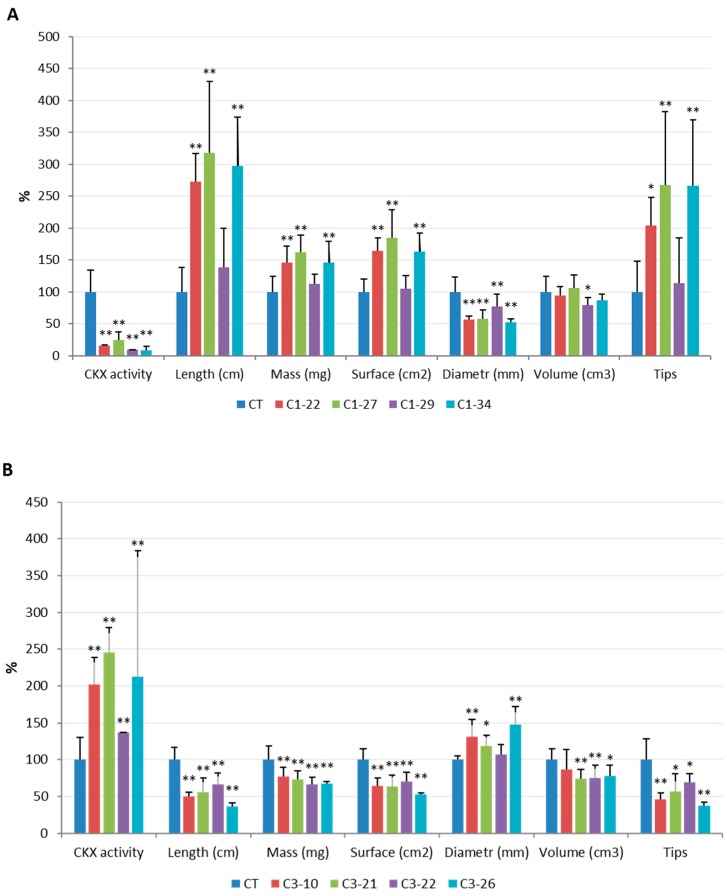
Figure 10.
Comparison of enzymatic CKX activity and select morphological characteristics of 10-day-old roots from ckx1 (A) and ckx3 (B) mutant lines. The data are presented as the percentage of the values in control plants (CT), which were set to 100%, the actual values were shown in Tables S12 and S13. Root parameters were measured for seven to 10 biological replicates, which were significantly different from control at * p < 0.05, ** p < 0.01.

