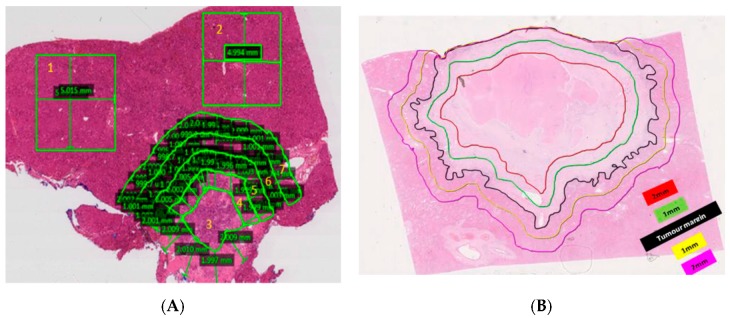
Figure 1.
Example of zonal analysis on histopathology. (A) Method that was developed for calculation of microsphere deposition density. 1 and 2 = non-neoplastic tissue (NNT), 3 = Tumour centre, 4 = 1–2 mm zone within tumour border, 5 = 0–1 mm zone within tumour border, 6 = 0–1 mm zone away from tumour border, 7 = 1–2 mm zone away from tumour border. Slide magnification = 0.3×. (B) Illustration of the 1 mm and 2 mm zones from the tumour margin that microsphere densities were measured within. The highest density was found within 1 mm from the tumour periphery.

