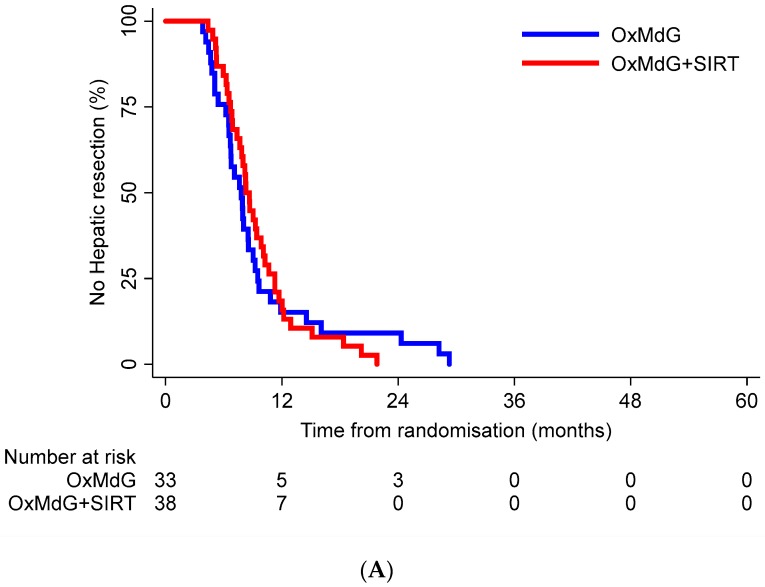
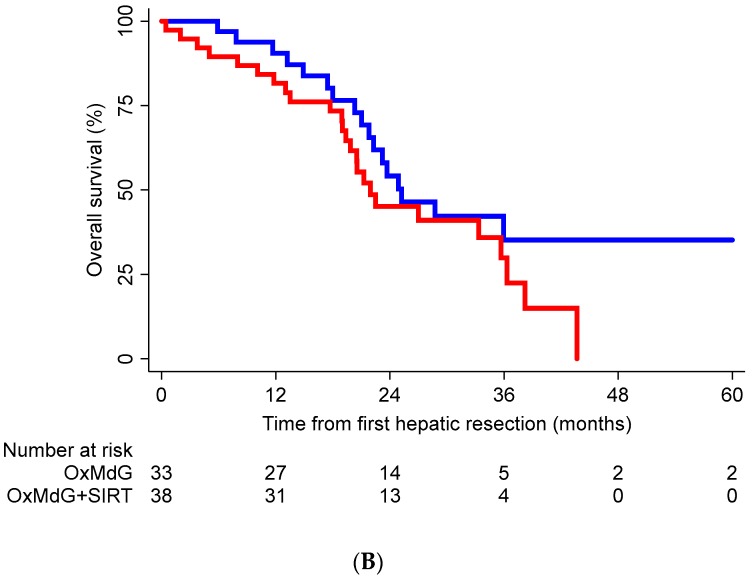
Figure 3.
Kaplan-Meier curves for time to resection (A) and time to death (B). (A) Kaplan-Meier curve of time from randomisation to hepatic resection for each treatment group during the FOXFIRE study duration. (B) Kaplan-Meier curve of time from hepatic resection to death for each treatment group during the FOXFIRE study duration.


