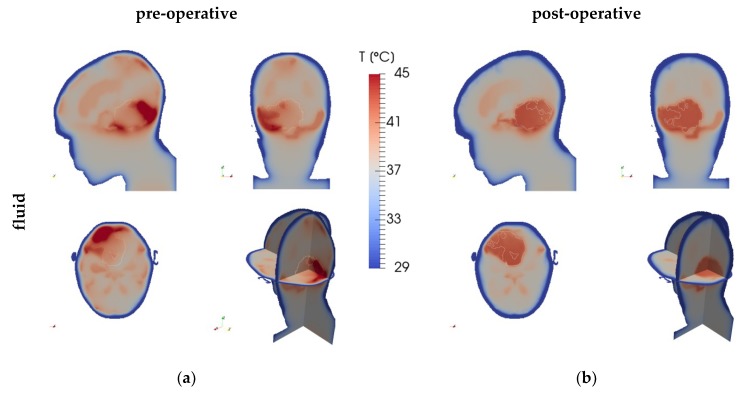
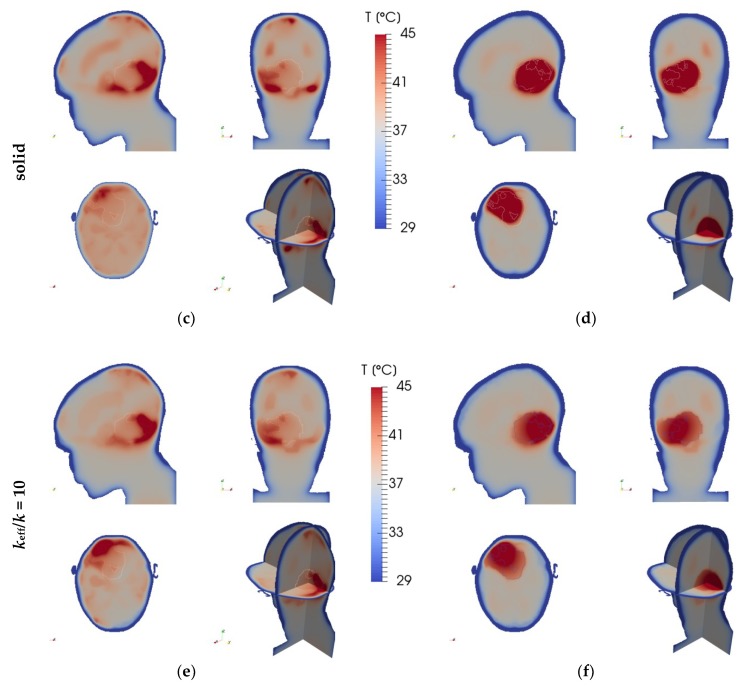
Figure 3.
Temperature distributions for (a,c,e) the pre-operative and (b,d,f) post-operative cases, as predicted by (a,b) the fluid model, (c,d) the solid model, and (e,f) the high-k (keff/k = 10) model, per case based on the same SAR distribution (Figure 2). The panels show planes through the tumour’s centre of gravity in the left-right (top-left), anterior-posterior (top-right), and cranial-caudal (bottom-left) directions, and a 3D view (bottom-right). The tumour (region) is outlined.


