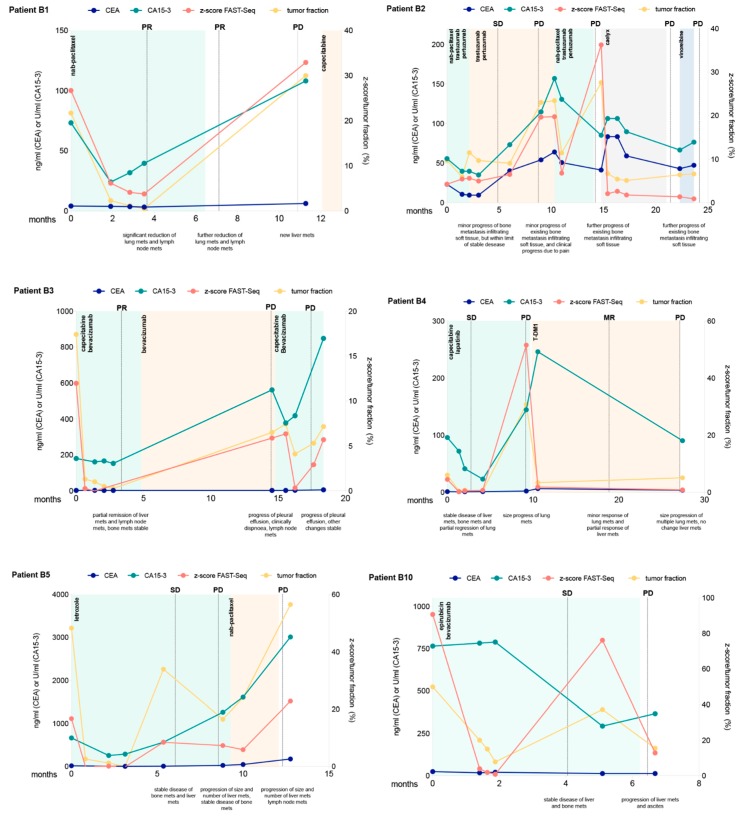
Figure 3.
Longitudinal monitoring of z-scores and ichorCNA tumor fractions in circulating tumor DNA indicated for eight selected patients. Multiple measurements of tumor markers CEA and CA15-3 are also shown over time. Therapy regimens are indicated as colored shading and disease status at various times (ascertained on computed tomography or MRI) is shown as vertical dotted lines. SD denotes stable disease, PD progressive disease, PR partial response and MR minor response.


