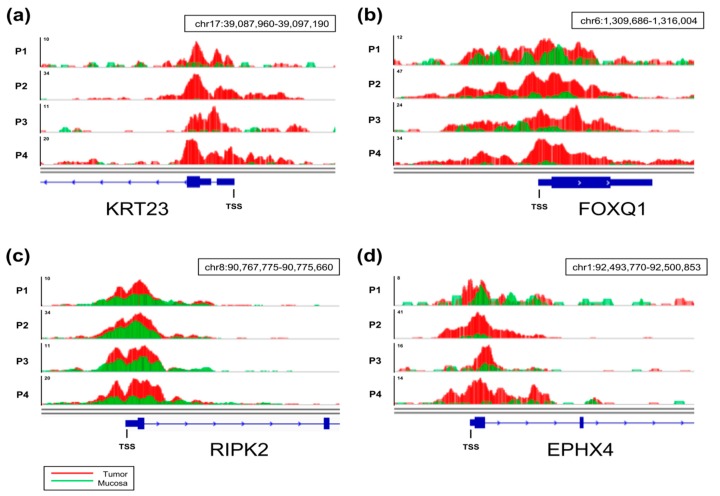
Figure 3.
ChIP-seq tracks for H3K27ac occupancy. Representative tracks are displayed for RIPK2 (a), EPHX4 (b), FOXQ1 (c), and KRT23 (d) for all four patients (P1–P4). The corresponding gene is displayed in blue, and the transcriptional start site (TSS) is highlighted. The direction of transcription is marked with blue arrows within the gene. Tumors (red) and matched normal mucosa (green) are overlaid.

