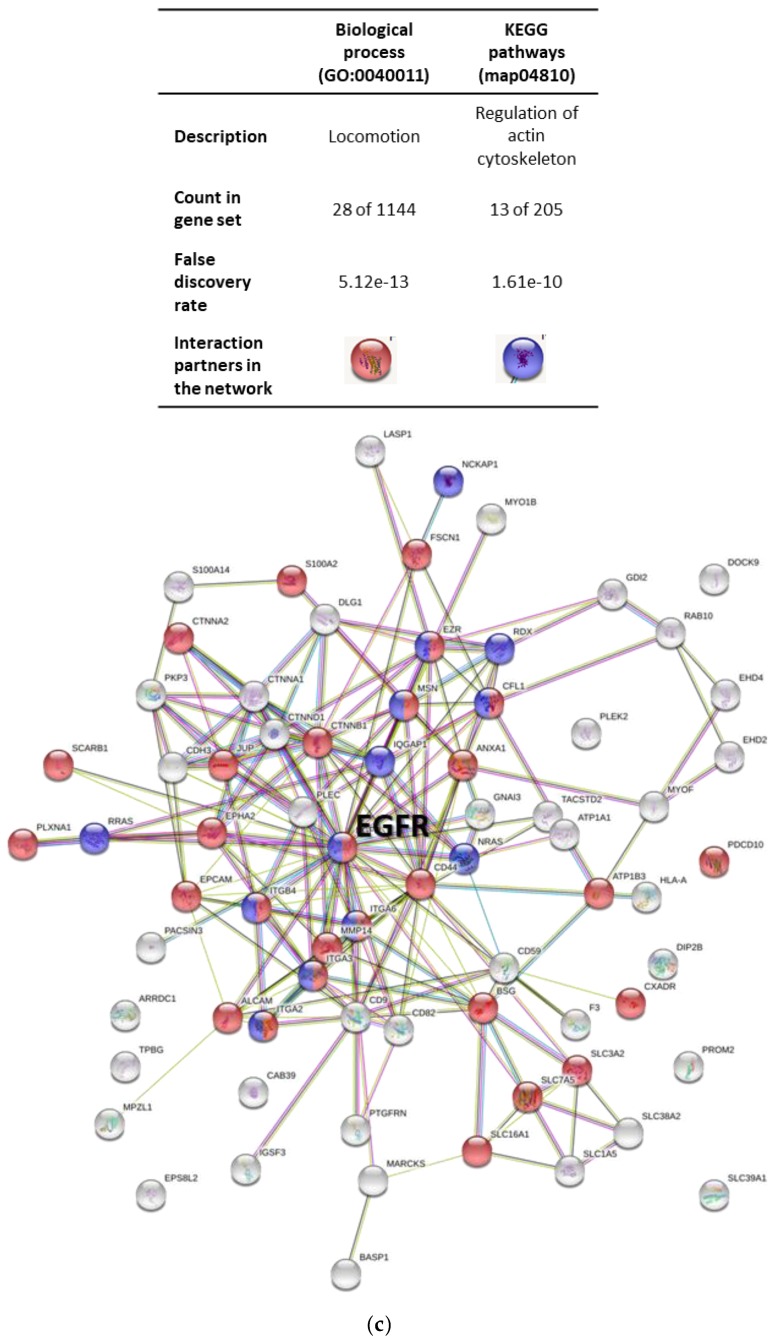
Figure 3.
Protein profile and network of OSCC derived EVs. (a) Volcano scatter plots showing proteins with differential expression in the EVs derived from OSCC cells. (b) Venn chart depicted the overlapping of the differentially expressed proteins in EVs (all published in Vesiclepedia) derived from three OSCC cell lines. (c) Networks of proteins which downregulated in the EVs derived from cisplatin-resistant OSCC cells (STRING database: https://string-db.org/).


