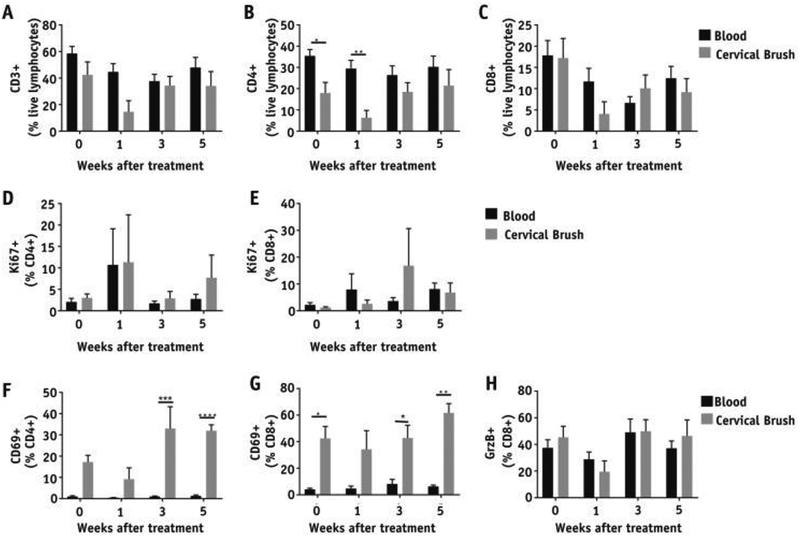
Fig. 4.
Comparison of T-cell frequencies and their activation status in the cervix and blood from patients with cervical cancer throughout chemoradiation therapy. Percentages of (A) CD3+, (B) CD4+, and (C) CD8+ T cells among live lymphocytes. Percentages of Ki67+ cells among (D) CD4+ and (E) CD8+ T cells. Percentages of CD69+ cells among (F) CD4+ and (G) CD8+ T cells. Percentages of granzyme B+ cells among CD8+ T cells (H) in cervical brushes and blood (n = 9).

