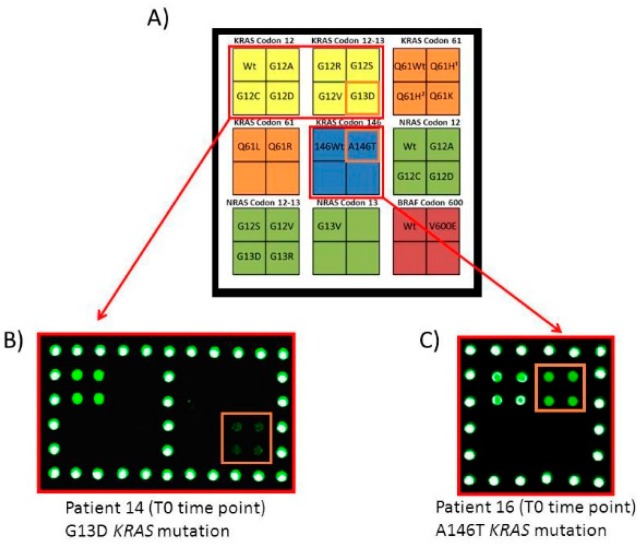
Figure 2.
Microarray analysis of ctDNA extracted from plasma of patient 14 and 16 at T0 time point. (A) Schematic representation of the spotted barcode probe array. Each position in the grid identifies an individual barcode probe address corresponding to KRAS codon 12-13, KRAS codon 61 (Q61H1 c.183A>C, Q61H2 c.183A>T), KRAS codon 146, NRAS codon 12-13 and BRAF mutations. Silicon chips coated with copoly(DMA-NAS-MAPS) are used as substrates for the covalent attachment of amino-modified barcode probe oligonucleotides arrayed at discrete locations. The white portion of the array is spotted with an amino-modified oligonucleotide (COCU8), not correlated with the genes, to be used as reference spots. (B) Microarray scanning of the Cy3 fluorescence signal of the analysis of ctDNA extracted from plasma of patient 14 at T0 time point. Only the part of the array corresponding to the barcode probes for KRAS codon 12 and 13 is shown. The robotically spotted array is hybridized with an individual single strand PCR incubated with the whole set of dual-domain reporters. The fluorescence detection is obtained incubating the array with a mixture of the universal Cy3 labelled oligonucleotide complementary to the tagged-reverse primer of the single strand PCR and with a Cy3-labeled oligonucleotide (COCU10) complementary to COCU8. The barcode probes corresponding to KRAS G13D is highlighted. (C) Microarray scanning of the Cy3 fluorescence signal of the analysis of ctDNA extracted from plasma of patient 16 at T0 time point. Only the part of the array corresponding to the barcode probes for KRAS codon 146 is shown. The frame highlights the barcode probes corresponding to the KRAS A146T mutation.

