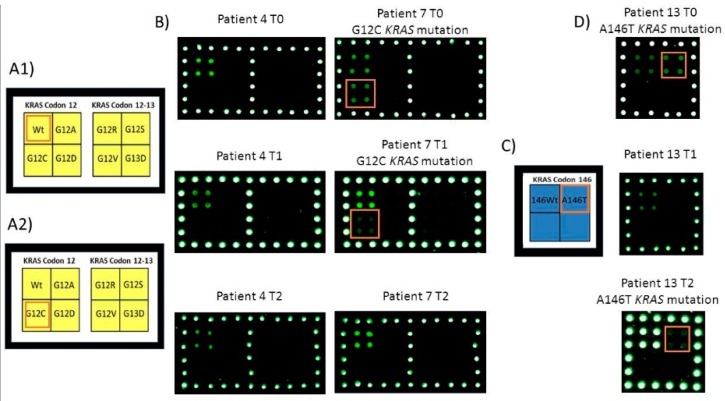
Figure 4.
Analysis of ctDNA extracted from plasma of patient 4, 7 and 13 at T0, T1 and T2 time points. (A1,A2) Spotting schema of the portion of the barcode probe array reported in Figure 2A corresponding to the barcode probes for KRAS codon 12 and 13. (B) Cy3 fluorescence images of the analysis of ctDNA extracted from plasma of patient 4 and 7 at T0, T1 and T2 time points. The barcode probes corresponding to KRAS G12C in patient 7 are highlighted; the patient 4 is KRAS wild-type. (C) Spotting schema of the portion of the barcode probe array reported in Figure 2A corresponding to the barcode probes for KRAS codon 146. (D) Cy3 fluorescence images of the analysis of ctDNA extracted from plasma of patient 13 at T0, T1 and T2 time points. The barcode probes corresponding to KRAS A146T in patient 13 are highlighted.

