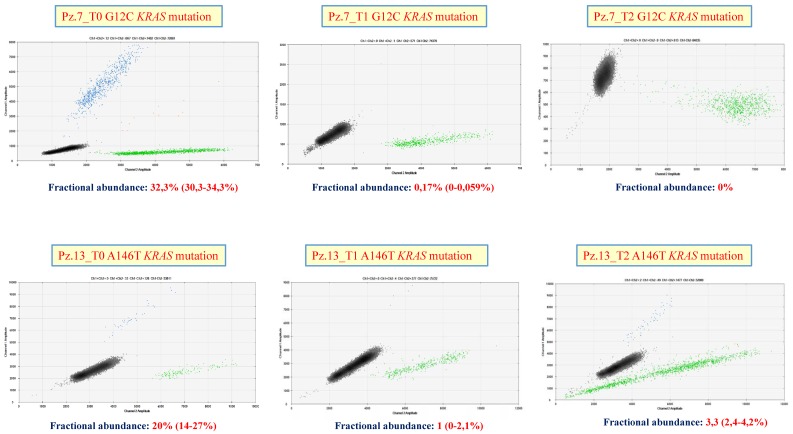
Figure 5.
Droplet digital PCR analysis. Examples of ddPCR plot for two metastatic colorectal cancer (mCRC) patients (n.7 and n.13) and respective fractional abundance of the mutated KRAS allele at the 3 time point: Patient n.7 = G12C KRAS mutation (upper panel) and Patient n.13 = A146T KRAS mutation (lower panel). Mutants are clustered in the upper left corner with high Fluorescein (FAM) fluorescent intensities (blue), wild-type is clustered in lower right corner with high Hexachloro-fluorescein (HEX) fluorescent intensities (green) while mutant plus wild-type sequences are clustered in the upper right corner (orange). The empty droplets are represented in black.

