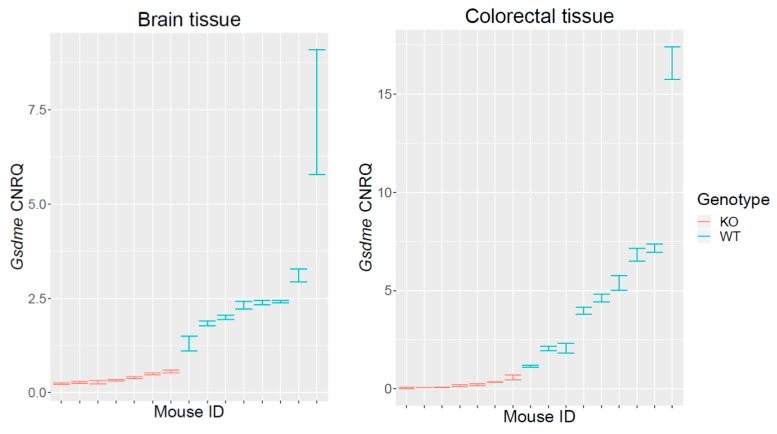
Figure 1.
qRT-PCR analyses on Gsdme KO and WT mice. qRT-PCR analyses for Gsdme mRNA expression on Gsdme KO (n = 7) and WT (n = 9) mice, both on brain (n = 15) and colorectal (n = 16) tissues were performed. The Calibrated Normalized Relative Quantity (CNRQ) ± standard error (se) is represented for every sample. The expression patterns in colon and in brain tissues were similar. There was only very low to no measurable Gsdme expression in Gsdme KO mice, in contrast to WT mice where Gsdme expression was higher and more variable.

