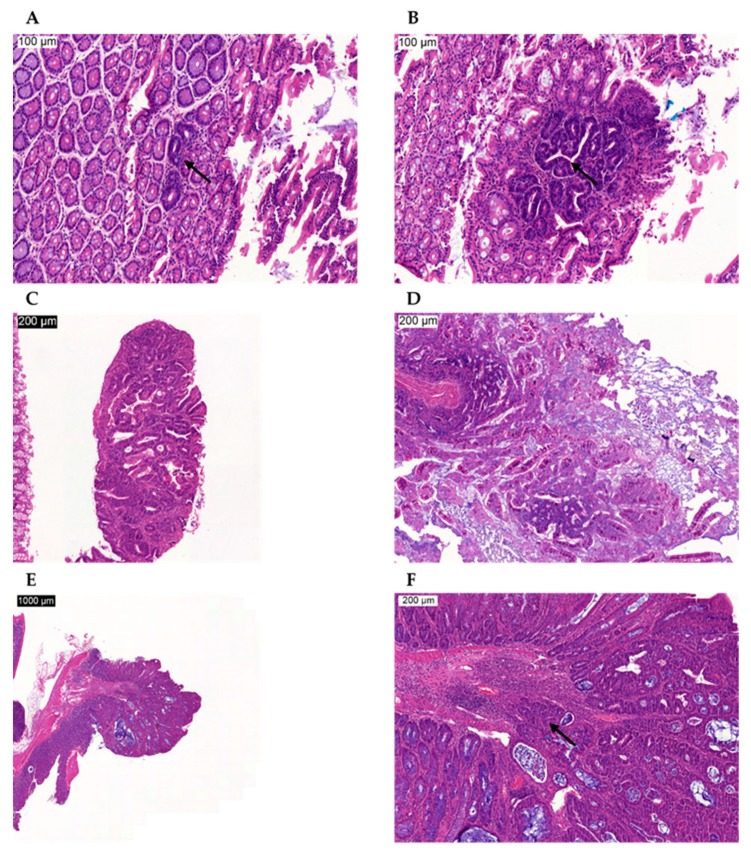
Figure 4.
Microscopic images of proliferative lesions in AOM-treated mice. (A) Typical hyperplasia, indicated by the arrow, in the large intestine. (B) Atypical hyperplasia, indicated by the arrow, in the large intestine. (C) Adenoma in the large intestine. (D) Adenoma in the small intestine. (E) Adenocarcinoma in the large intestine. (F) Magnification of the adenocarcinoma in the large intestine (E). The arrow indicates infiltration of the adenocarcinoma in the submucosa. Scale bars are indicated on the images.

