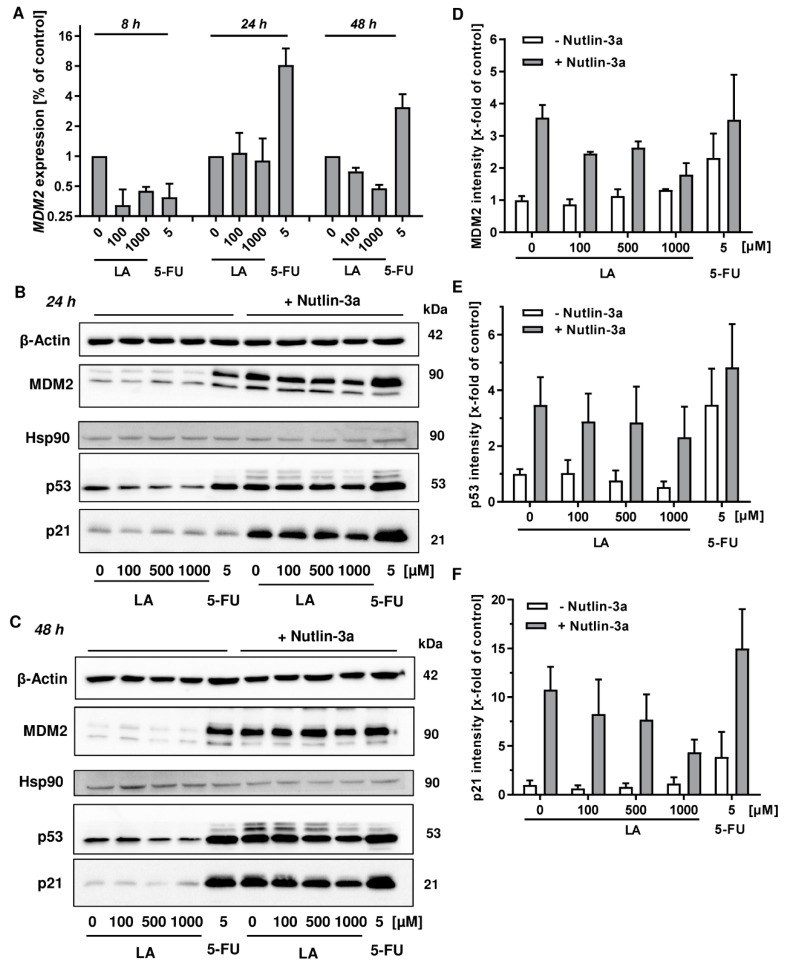
Figure 7.
Role of MDM2 in LA-triggered p53-depletion in HCT116 cells. (A) Time course of MDM2 gene expression. Cells were exposed to LA as indicated. EtOH was used as solvent control (0 µM LA), while 5-FU was used as positive control. (B,C) HCT116 were treated with increasing doses of LA for 24 h (B) or 48 h (C) either with or without the MDM2 inhibitor Nutlin-3a. In addition, 5-FU (5 µM) was used as positive control for p53 and p53-dependent MDM2 and p21 induction. Cells were analyzed by SDS-PAGE followed by western blot detection of MDM2, p53 and p21. Either Hsp90 or β-Actin served as loading control. (D–F) Densitometric quantification of MDM2 (D), p53 (E), and p21 (F) normalized to the respective loading controls obtained from three independent experiments as described and shown in (B). Data are displayed as mean + SEM of three independent experiments.

