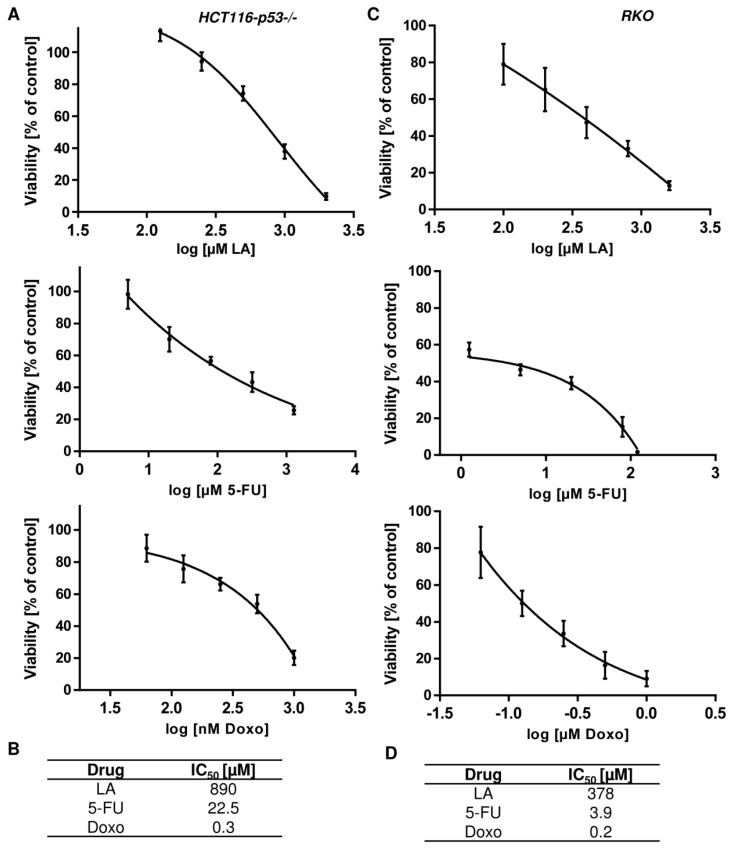
Figure A4.
Determination of drug concentrations for application of the Chou–Talalay method. HCT116-p53−/− (left panel) and RKO (right panel) cells were treated with increasing fixed-ratio doses of (A) LA for 120 h or 5-FU/Doxo for 72 h respectively. Cell viability was measured using ATP assays and normalized to solvent treated control cells. Drug concentrations were transformed into log-scale and plotted against the cell viability. The curve was fitted by non-linear regression with variable slope, providing the IC50-values. Data are presented as mean + SEM, n = 2, triplicates. (B) Summary of IC50-values.

