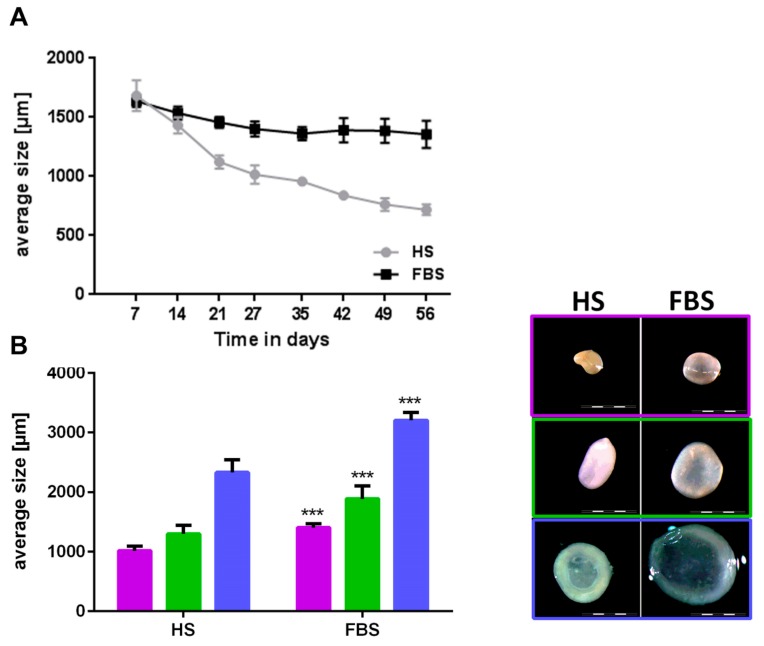
Figure 5.
Comparison of size and macroscopic appearance of microtissues after cultivation in either HS or FBS. (A) Development of the size of microtissues from one representative donor over the course of 8 weeks. (B, left) Mean sizes of 10 microtissues of three donors after 4 weeks of cultivation. Each color represents a different donor. (B, right) Macroscopy of microtissues of the corresponding donors depicted in the graph. Scale bars: 2000 µm. Data are depicted as mean ± SD.

