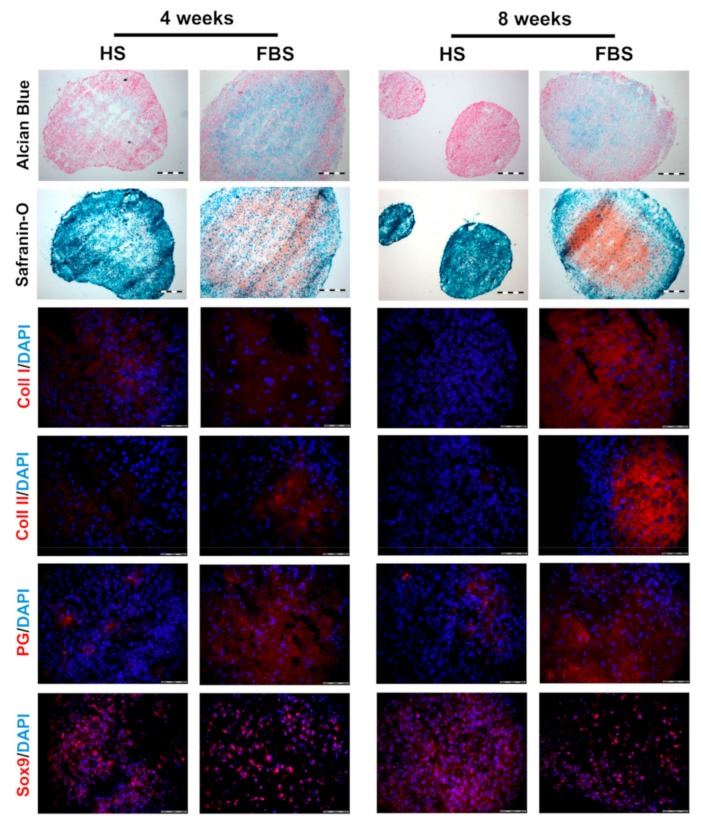
Figure 6.
Comparison of the differentiation degree of microtissues from one representative donor after 4 and 8 weeks of cultivation using cryosections. (Upper rows) Histological analyses visualizing glycosaminoglycans (Alcian Blue: Blue, Safranin O: Red) and cell nuclei (Alcian Blue: Pink, Safranin O: Cyan). Scale bars: 200 µm. (Lower rows) Immunohistochemical analyses of cartilage-specific markers. Red: Collagen type I (Coll I), collagen type II (Coll II), proteoglycans (PG), and Sox9, respectively. Blue: Cell nuclei. Scale bars: 50 µm.

