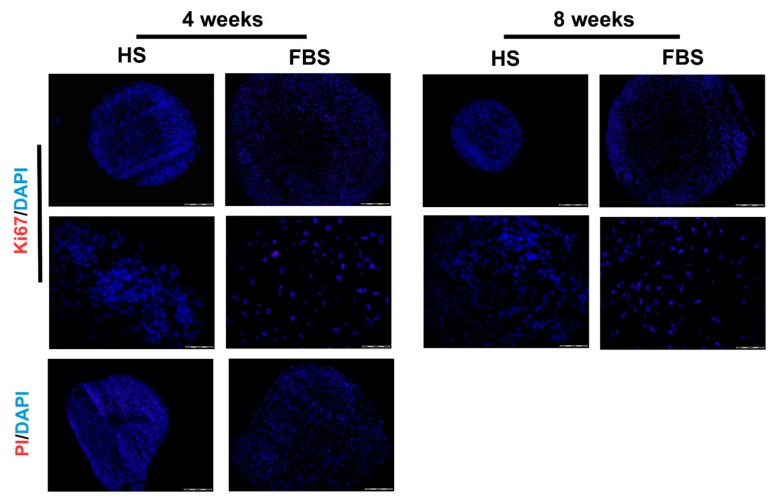
Figure 7.
Analysis of cell proliferation and viability of microtissues from one representative donor cultivated for 4 weeks in the medium containing either HS or FBS. (Upper rows) Immunohistochemical analysis of the proliferation marker, Ki67. Red: Ki67. Blue: Cell nuclei. Scale bars upper row: 200 µm. Scale bars lower row: 50 µm. (Lower row) Viability staining using propidium iodide (PI). Red: Propidium iodide. Blue: Cell nuclei. Scale bars: 50 µm.

