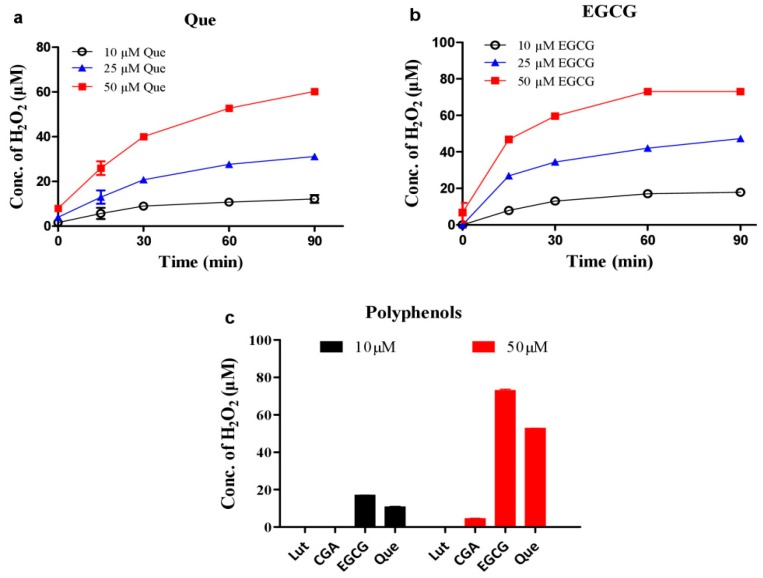
Figure 4.
Hydrogen peroxide levels produced by dietary polyphenols. (a) quercetin (Que). (b) EGCG. (c) Comparison of different polyphenols (Lut: luteolin; CGA: chlorogenic acid). Chemicals were mixed in 0.02 M PBS (pH 8.0) and incubated at 37 °C for indicated time in a and b or 1 h in c. Data are presented as the mean of two replicates; the error bar represents the range. In most data points, the range was smaller than the symbol.

