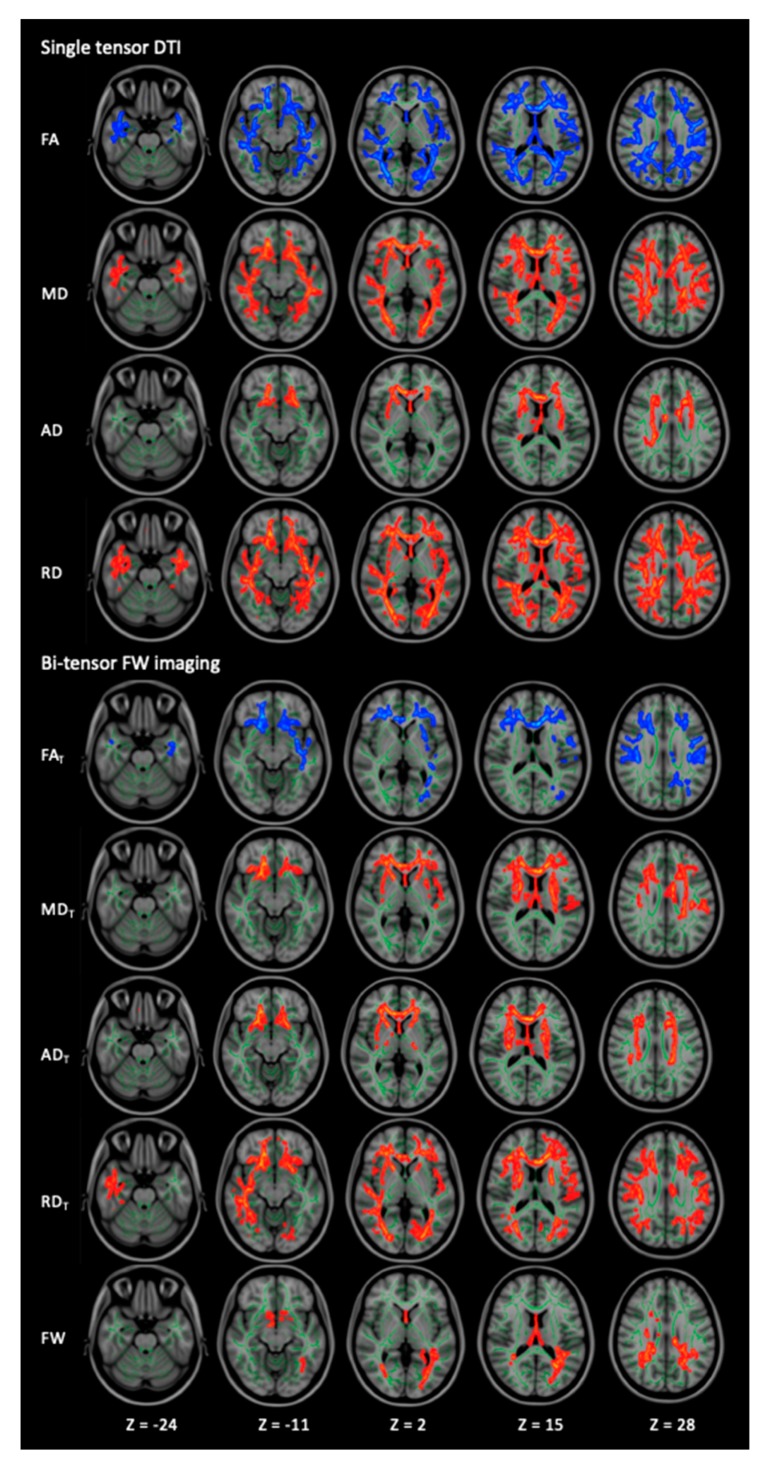
Figure 1.
Comparison of DTI (FA, MD, AD, and RD) and FW imaging (FAT, MDT, ADT, RDT, and FW) indices between healthy controls and patients with PD. TBSS analyses show that patients with PD have significantly (p < 0.05, FWE-corrected) lower FA and FAT (blue/light-blue voxels) and significantly higher MD, MDT, AD, ADT, RD, RDT, and FW (red-yellow voxels) compared with healthy controls. The skeleton is presented in green. To aid visualization, the results are thickened using the fill script implemented in the FMRIB Software Library. AD, axial diffusivity; ADT, free water-corrected axial diffusivity; DTI: diffusion tensor imaging; FA, fractional anisotropy; FAT, free water-corrected fractional anisotropy; FW, free water; MD, mean diffusivity; MDT, free water-corrected mean diffusivity; PD, Parkinson’s disease; RD, radial diffusivity; RDT, free water-corrected radial diffusivity; TBSS, tract-based spatial statistics.

