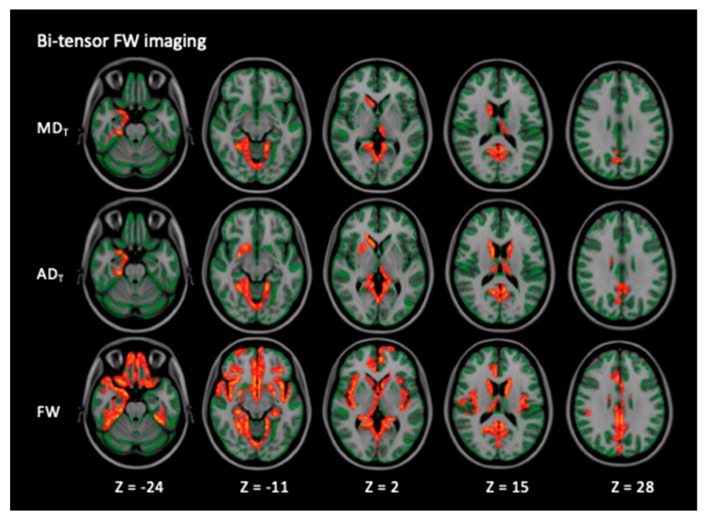
Figure 2.
Comparison of FW imaging (MDT, ADT, and FW) indices between the healthy controls and the patients with PD. GBSS analyses showed that the patients with PD had significantly higher MDT, ADT, and FW (red-yellow voxels) compared with the healthy controls (p < 0.05, FWE-corrected). The skeleton is presented in green. To aid visualization, the results are thickened using the fill script implemented in the FMRIB Software Library. AD, axial diffusivity; ADT, FW-corrected axial diffusivity; FW, free water; GBSS, gray matter-based spatial statistics; MD, mean diffusivity; MDT, FW-corrected mean diffusivity; PD, Parkinson’s disease.

