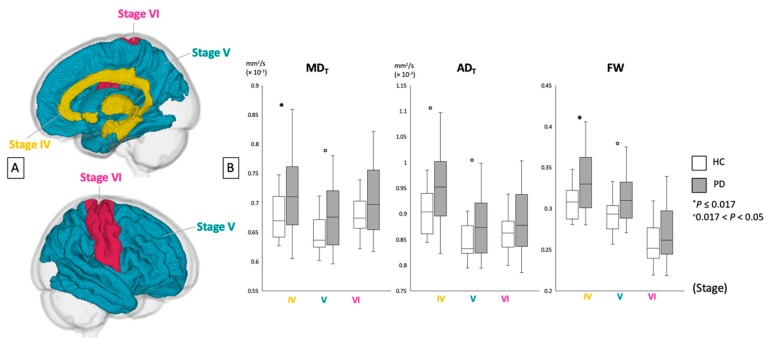
Figure 4.
(A) Region-of-interest analyses of gray matter areas belonging to Braak stages IV, V, and VI. (B) Mean values for FW imaging indices (MDT, ADT, and FW) of each area in healthy controls (white bars) and patients with PD (gray bars). ADT, free water-corrected axial diffusivity; FW, free water; HC, healthy controls; MDT, free water-corrected mean diffusivity; PD, Parkinson’s disease.

