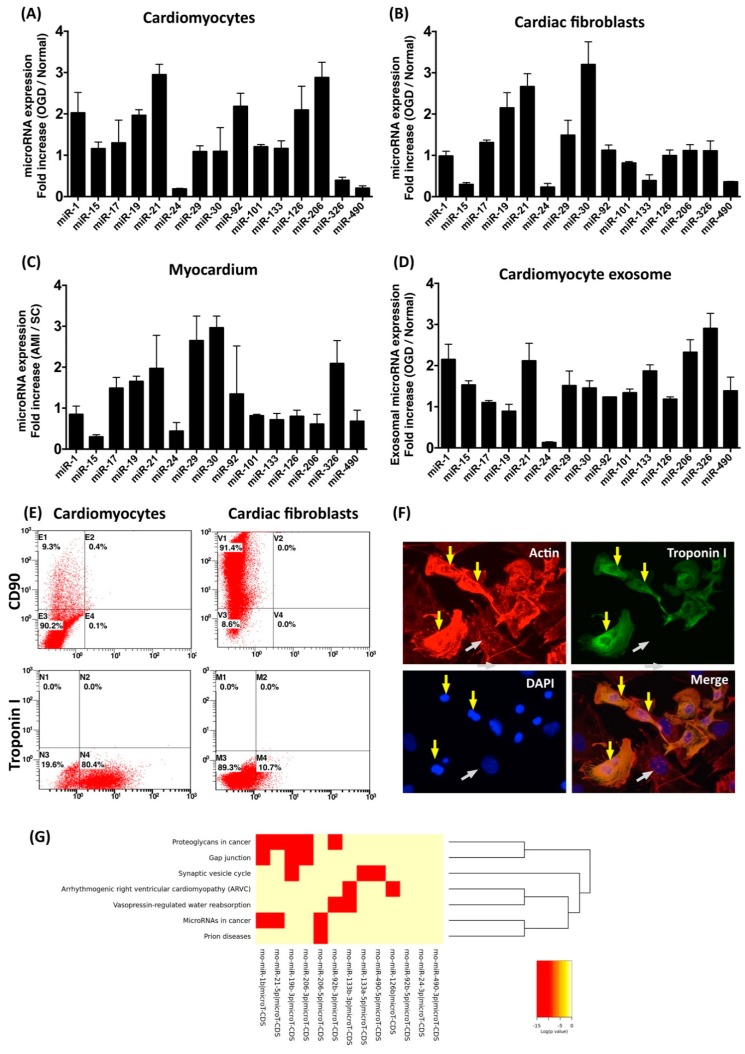
Figure 1.
Expression profile of myocardial-disease-associated microRNA in myocardium, cardiac fibroblasts, cardiomyocytes, and cardiomyocyte-derived conditioned medium. (A) Relative expression level of miRNAs in cardiomyocytes incubated under oxygen–glucose deprivation (OGD) and normal (normoxia with serum and glucose supply) conditions for 6 h. (B) Relative expression level of miRNAs in cardiac fibroblasts incubated in OGD and in normal condition for 6 h. (C) Relative expression level of miRNAs in ventricular myocardium with and without induction of acute myocardium infarction. (D) Relative expression level of miRNAs in conditioned medium derived from cardiomyocytes with and without OGD treatment. (E) Flow cytometric assessment with antibodies against CD90 (cardiac fibroblast marker) and troponin I (cardiomyocyte marker) to examine the population of isolated cardiac cells. (F) Immunofluorescent staining with antibodies against troponin I to identify isolated cardiomyocytes. Yellow arrows indicate cardiomyocytes with troponin I expression. White arrows indicate non-cardiomyocytes. (G) Heatmap generated from DIANA-miRPath 3.0 to show KEGG pathways targeted by OGD-regulated miRNAs in cardiomyocytes. Six hours after OGD treatment or acute myocardial infarction (AMI) induction, total RNAs were extracted from cells, myocardium, or conditioned medium, followed by real-time RT-PCR with specific microRNA primers. n = 3 for each group.

