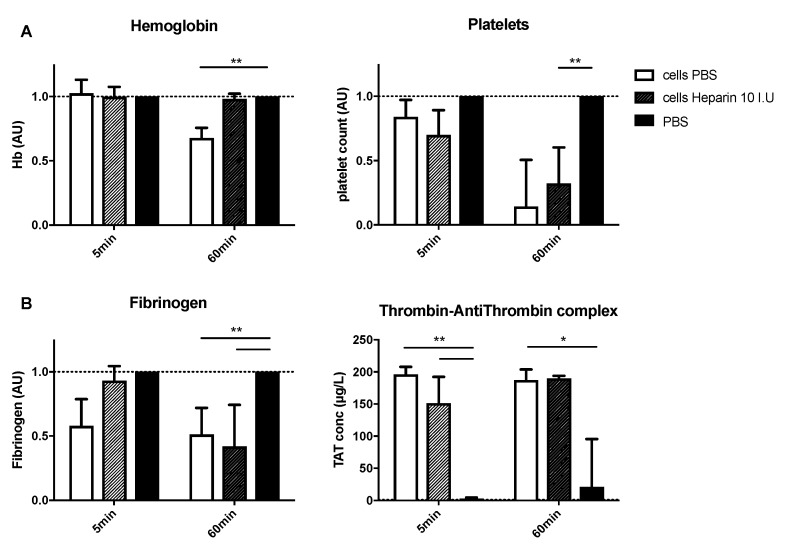
Figure 3.
HHALPCs were added to the tubing loops, with or without added low dose heparin (10 IU). Analyses were performed after 5 and 60 min. (A,B) Values (except for TAT complex levels) were normalized compared to those of control tubing loops containing only PBS. Data are expressed as arbitrary units (AU). Bars represent medians with interquartile ranges (n = 6). Mann–Whitney test (* p < 0.05, ** p < 0.01).

