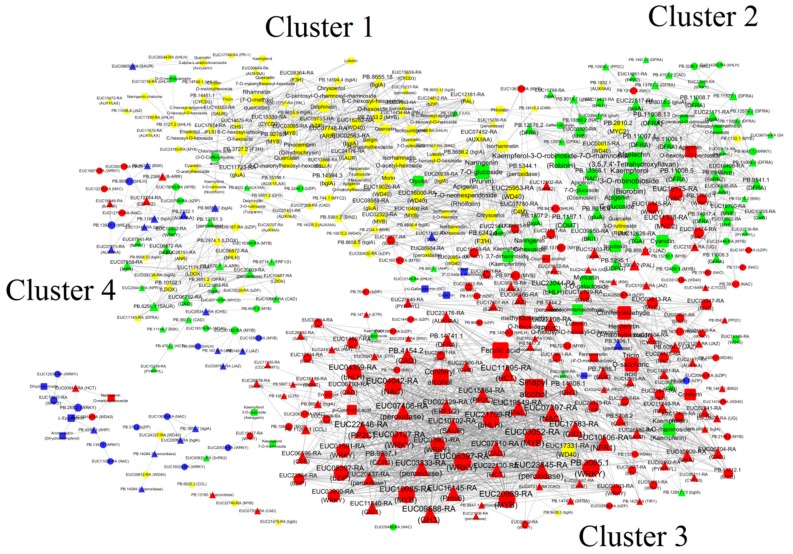
Figure 7.
Interaction network depicting isoform–isoform interactions and relationships between regulatory isoforms and phenylalanine- and flavonoid-related metabolites. Edges or connections represent co-expression between isoforms with a Pearson correlation coefficient (PCC) < −0.95 (solid line with a T-type arrow) or ≥ +0.95 (solid line with a normal arrow). Red, yellow, blue and green represent the isoforms with the highest expression levels in leaf buds (L1), growing leaves (3 cm long, L2), young leaves (L3) and old leaves (L4), respectively. The round rectangle, triangle and ellipse represent the metabolites, functional genes and transcription factors, respectively. Larger edges in the network indicate isoform edges with more connections.

