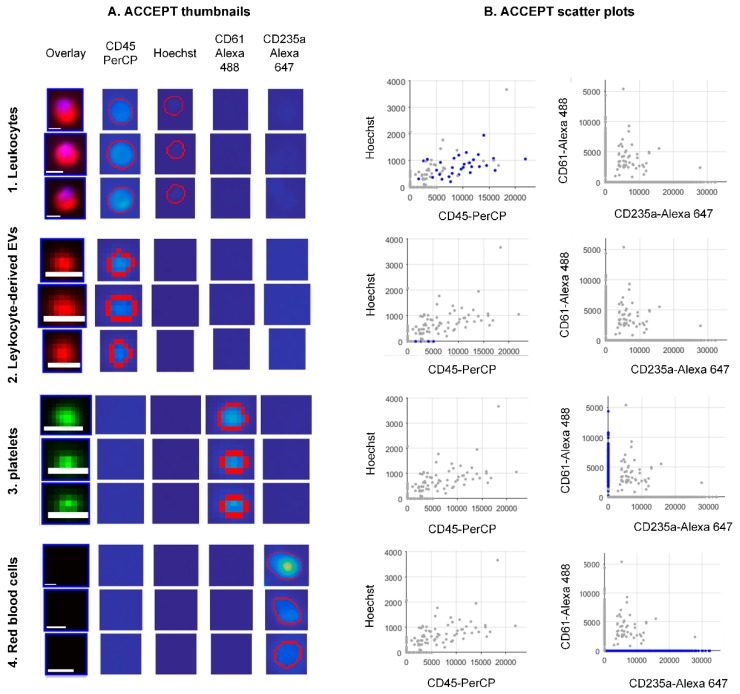
Figure 3.
Examples of objects detected in the immunofluorescence image data sets of blood samples without EpCAM enrichment. The objects fall in the ACCEPT gates, the names of which are indicated vertically. Panel (A) shows examples of ACCEPT thumbnails. Scale bars indicate 6.4 μm. Panel (B) shows scatter plots of the mean intensity of the Hoechst versus the mean intensity of CD45-PerCP and the mean intensity of CD61-Alexa 488 versus the mean intensity of CD235a-Alexa 647. Blue dots represent single events falling in the respective gate.

