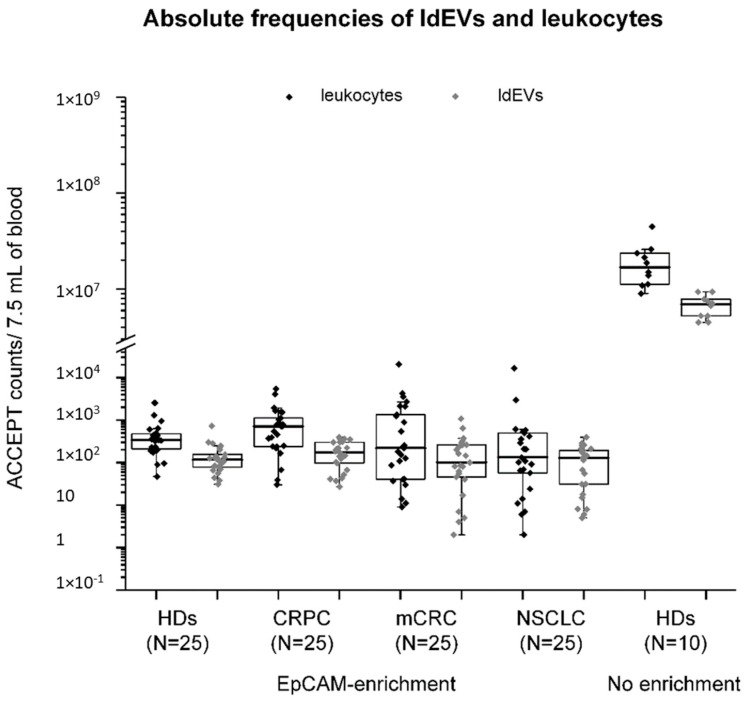
Figure 4.
Absolute frequencies of leukocytes and large ldEVs in 7.5 mL of the blood of individuals with and without EpCAM enrichment. The interquartile range of the absolute frequencies of leukocytes (data in black dots) and ldEVs (data in grey dots) in whole blood of 10 healthy individuals and EpCAM enriched blood samples of 25 healthy individuals (HDs) and 75 EpCAM-enriched blood samples of metastatic prostate (CRPC), colorectal (mCRC) and non-small cell lung (NSCLC) cancer patients are shown in box plots. Whiskers indicate max and min values as estimated by Q3 + 1.5*IQR and Q1—1.5*IQR, respectively, where Q1: lower quartile, Q3: upper quartile and IQR: interquartile range. Each dot in the case of the blood of healthy individuals without EpCAM-enrichment corresponds to the mean values of 4–6 technical replicates.

