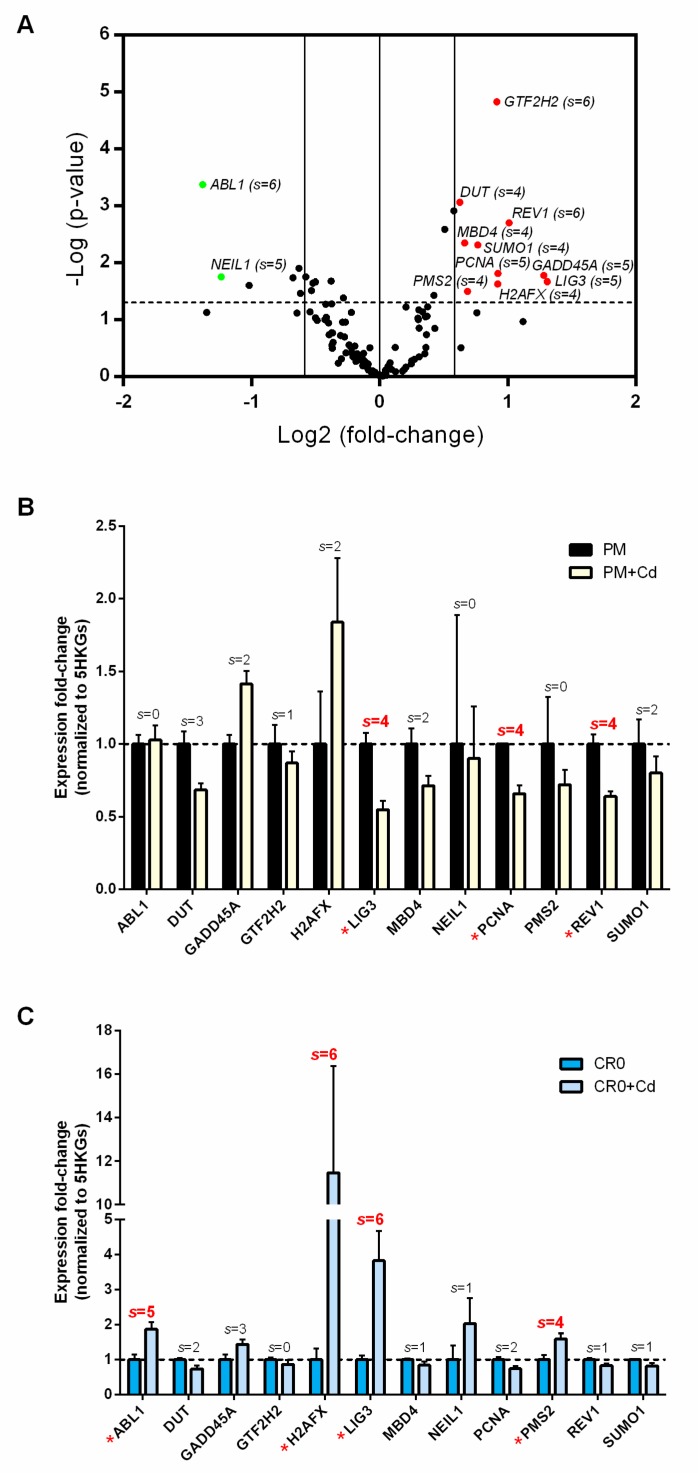
Figure 3.
DNA repair gene expression profile associated with Cd exposure. (A) Volcano plot of 117 DNA repair gene expression profiles of CR0 over PM cells when normalized to 5-housekeeping genes (5HKGs), modified from Figure S3F. Only expression of genes with an s-score (s) ≥ 4 were considered as significantly altered and highlighted in green (down-regulated) or red (up-regulated). Specifically, to gain an s-score (s = 1), a gene has to be p ≤ 0.05 and fold-change ≥1.5 upon normalization to a selected reference gene. Six references genes (ACTB, B2M, GAPDH, HPRT1, PRLP0, and 5HKGs) were used. Vertical lines on the x-axis represent 1.5 or –1.5 fold-change; dash line on the y-axis represents p ≤ 0.05. (B,C) Expression of the 12 differentially expressed DNA repair genes in PM and CR0 cells treated with 20 µM of CdCl2 for 72 h. Only expressions of genes with s ≥ 4 (highlighted in red asterisk) were considered significantly altered.

