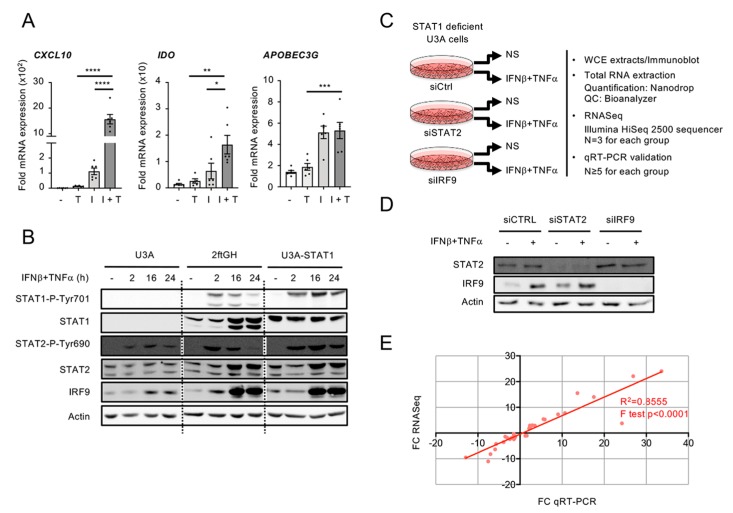
Figure 2.
Experimental design used to study the STAT1-independent delayed transcriptional program induced by the combination of IFNβ and TNF. (A) 2ftGH cells were stimulated with either TNF (T), IFNβ (I), or costimulated with IFNβ + TNF (I + T) for 24 h. Quantification of mRNA was performed by qRT-PCR and expressed as fold expression after normalization to the S9 mRNA levels using the ΔΔCt method. Mean +/− SEM, n ≥ 5. Statistical comparison was conducted using one-way ANOVA with Tukey’s post-test. p < 0.05 (*), p < 0.01 (**), p < 0.001 (***), or p < 0.0001 (****). (B) U3A (STAT1-deficient), 2ftGH (parental STAT1-positive) cells and U3A-STAT1 cells (U3A cells stably reconstituted with STAT1) were left untreated or stimulated with IFNβ + TNF for the indicated times. WCE (whole cell extracts) were analyzed by SDS-PAGE followed by immunoblot using anti STAT1-P-Tyr701, total STAT1, STAT2-P-Tyr690, total STAT2, IRF9, or actin antibodies. (C–E) U3A cells were transfected with siCTRL, siSTAT2, or siIRF9 before being left untreated (NS) or stimulated with IFNβ + TNF for 24 h. (C) The schematic describes the workflow of sample preparation and analysis. (D) WCE were analyzed by SDS-PAGE followed by immunoblot using anti STAT2, IRF9, and actin antibodies. (E) Graph showing the correlation between fold-changes (FC) measured by RNASeq and qRT-PCR for 13 randomly selected genes. Data from siCTRL NS vs. siCTRL IFNβ +TNF, siSTAT2 IFNβ +TNF vs. siCTRL IFNβ + TNF, siIRF9 IFNβ + TNF vs. siCTRL IFNβ + TNF conditions were used.

