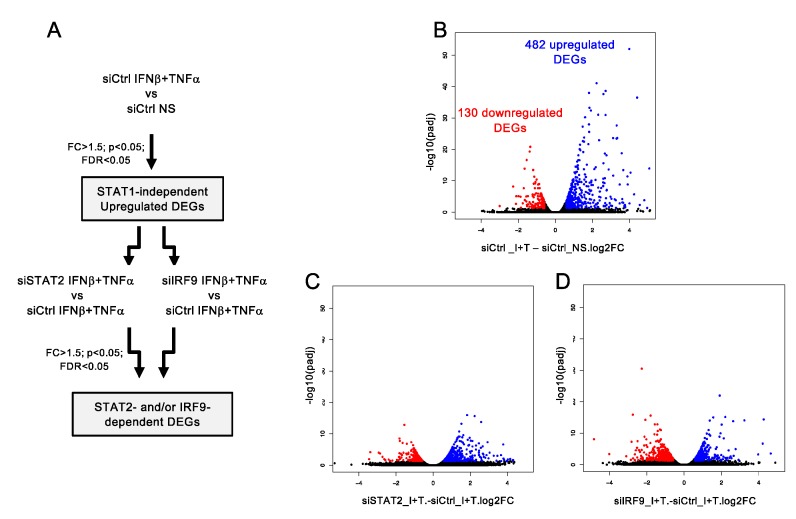
Figure 3.
Analysis of STAT1-independent IFNβ + TNF-induced DEGs. (A) Diagram describing the bioinformatics analysis strategy used to determine STAT1-independent differentially expressed genes (DEGs) and their regulation by STAT2 and IRF9. (B) Volcano plots of the fold-change (FC) vs. adjusted p-value of IFNβ + TNF (Ι + Τ) vs. non-stimulated (NS) siCtrl conditions. (C) Volcano plots of the fold-change vs. adjusted p-value of siSTAT2 IFNβ + TNF vs. siCTRL IFNβ + TNF (I + T) conditions. (D) Volcano plots of the fold-change vs. adjusted p-value of siIRF9 IFNβ + TNF vs. siCTRL IFNβ + TNF conditions.

