Figure 4.
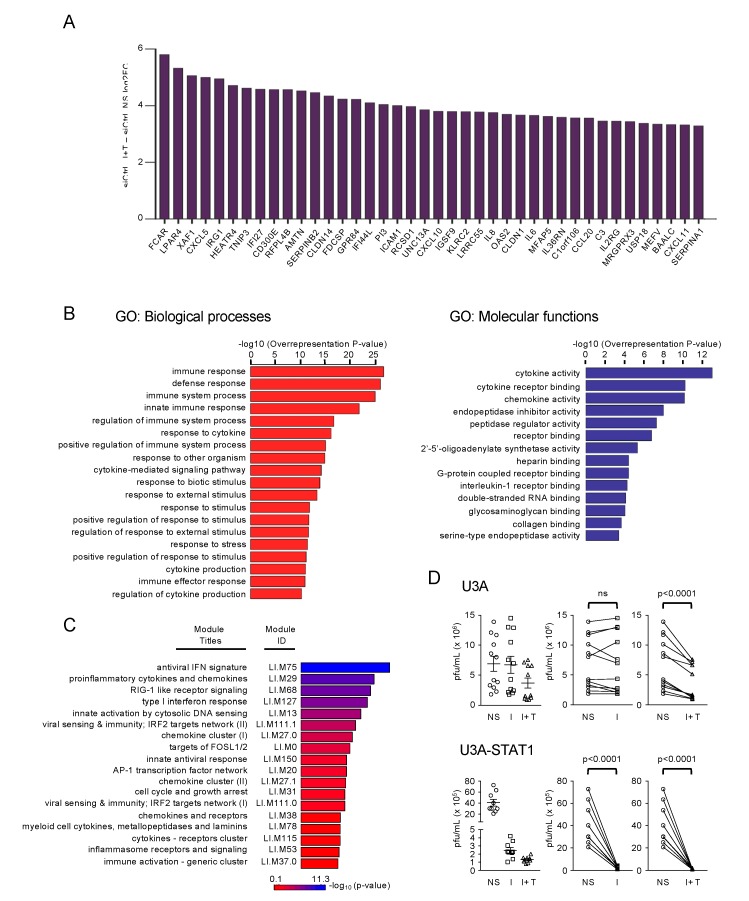
Functional characterization of STAT1-independent IFNβ + TNF-induced DEGs. (A) Top forty IFNβ + TNF- upregulated DEGs. (B) Gene ontology (GO) enrichment analysis of the differentially upregulated genes in IFNβ + TNF vs. non-stimulated siCtrl conditions based on the Biological Processes and Molecular Function categories. Top enriched terms are shown and the full list is available in Supplemental Table S2. (C) Modular transcription analysis of upregulated DEGs. Eighteen enriched modules are shown. The full list of enriched modules is available in Supplemental Table S3. (D) U3A and STAT1-rescued U3A-STAT1 cells were stimulated with IFNβ (I) or IFNβ + TNF (I + T) for 30 h before infection with VSV at a MOI of 5 for 12 h. The release of infectious viral particles was quantified by plaque forming unit (pfu) assay. The left graphs show dot-plots of all stimulations. Statistical comparisons were performed on the “before and after” plots (displayed on the right of dot-plot graphs) using ratio paired t-tests.

