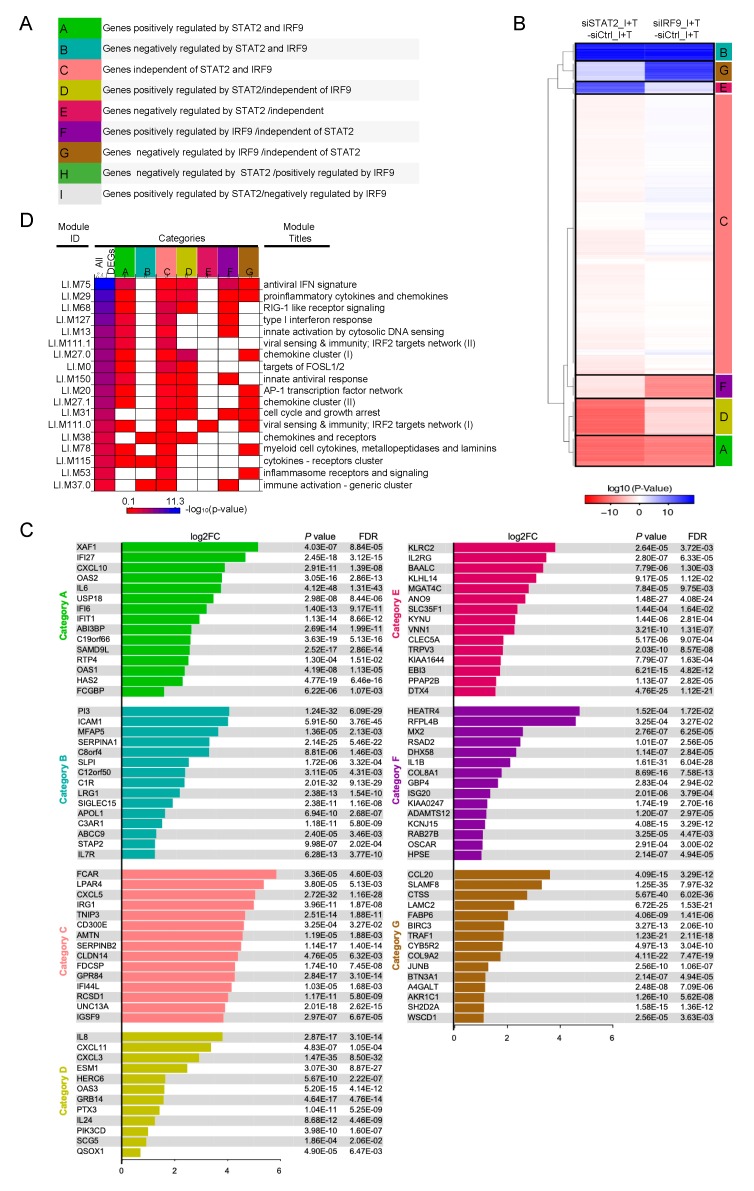
Figure 5.
Clustering of IFNβ + TNF-induced DEGs according to their regulation by STAT2 and IRF9. (A) Theoretical categories in which IFNβ + TNF-induced DEGs can be segregated based on their potential individual regulation by STAT2 and IRF9. (B) Hierarchical clustering of the categories of DEG responses according to their regulation by STAT2 and IRF9. Euclidean distance metric is used for the construction of distance matrix and the categories are used as a priori input into clustering algorithm as detailed in Materials and Methods. (C) Top 15 induced DEGs (Log2FC, siCTRL NS vs. siCTRL IFNβ + TNF) in each category identified in (B) are displayed. Note that category D contains only twelve genes, so all genes are shown. The full list of genes is available in Supplemental Table S1. (D) Diagram showing enriched transcription modules in each gene category.

