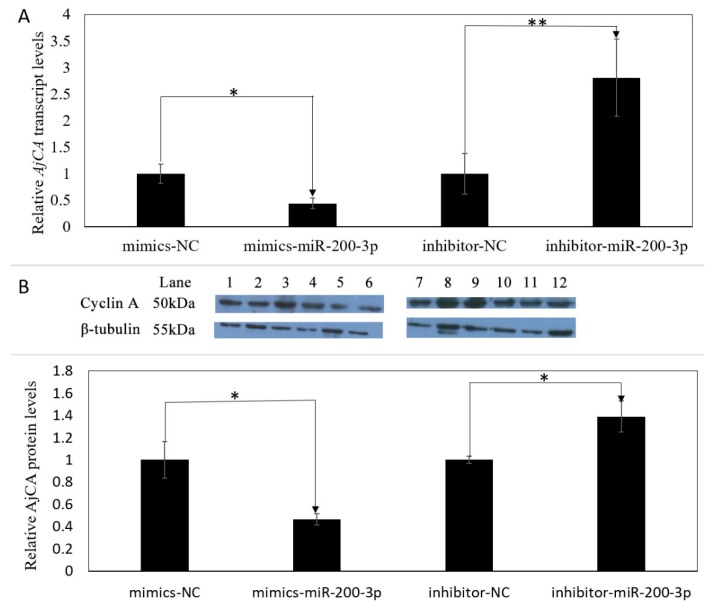
Figure 6.
Gain and loss of function analysis of miR-200-3p in the intestine of A. japonicus in vivo. (A) Relative AjCA transcript levels after transfection with miR-200-3p mimics or inhibitor. Values were normalized against β-tubulin and β-actin. Values are means ± SE (n = 5). * indicates a significant difference (p < 0.05); ** (p < 0.01). (B) Relative AjCA protein production after transfection with miRNA mimics or inhibitor. Representative bands show blot intensity. Lanes show the treatments as follows: (1–3) miR-200-3p mimics, negative control; (4–6) miR-200-3p mimics; (7–9) miR-200-3p inhibitor, negative control; (10–12) miR-200-3p inhibitor. Corresponding tubulin bands are also shown. Values were standardized against the corresponding densities for β-tubulin. Values are means ± SE (n = 3). * indicates a significant difference (p < 0.05).

