. 2019 Sep 3;8:e47615. doi: 10.7554/eLife.47615

Figure 2. Epidemiological maps of Salmon pescarenavirus 1 and 2 (SPAV-1 and SPAV-2), Chinook aquareovirus (CAV) and Pacific salmon nidovirus (PsNV) around the coast of Vancouver Island.

Individual samples are shown at the location collected, negative samples are black, and positive samples are coloured and sized according to the virus copy number. A small degree of random noise was added to the longitude and latitude to prevent overplotting.

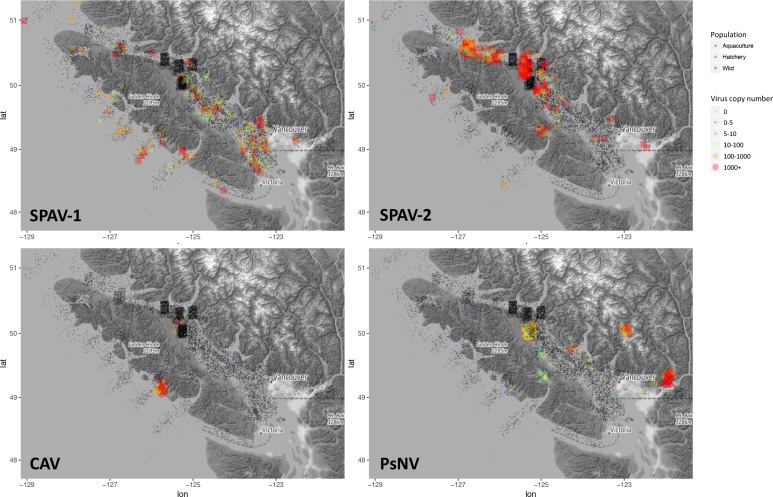
Figure 2—source data 1. Source data (RT-PCR copy number and sampling locations) for hte epidemiological maps.
DOI: 10.7554/eLife.47615.015

Figure 2.

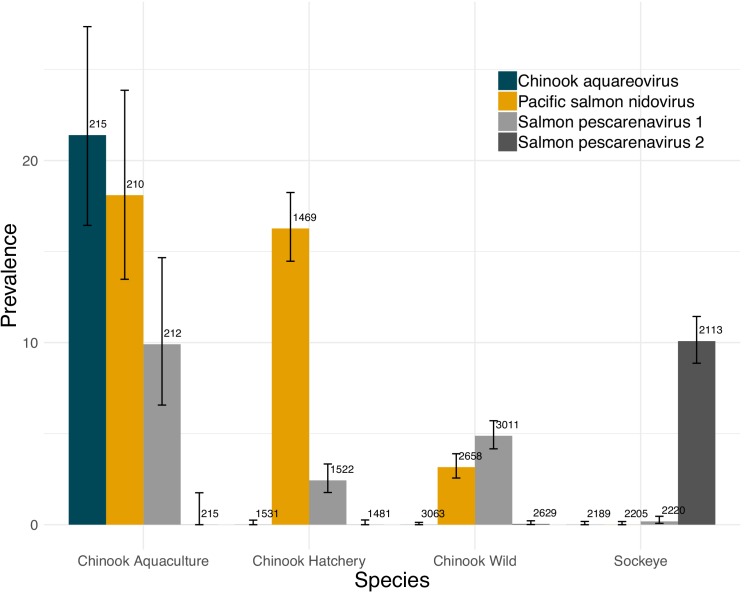
Figure 2—figure supplement 1. Summary of RT-PCR for SPAV-1 and −2, PsNV and CAV using the Biomark Fluidigm platform.

Figure 2—figure supplement 1.

The data shown are the prevalence (percentage) of positive amplifications above the calculated limit of detection (95%). Numbers show the sample size and error bars show Wilson’s binomial confidence intervals. Hatchery Chinook are fish with clipped fins, whilst wild represent all other wild caught fish.

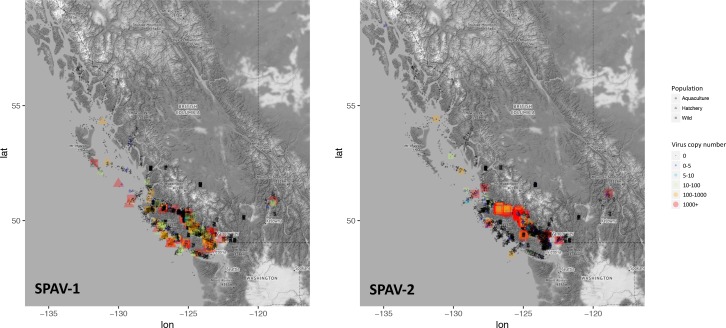
Figure 2—figure supplement 2. Epidemiological maps from Washington to Alaska of Salmon pescarenavirus 1 and 2 (SPAV-1 and SPAV-2).

Figure 2—figure supplement 2.

Individual samples are shown at the location collected, samples negative for SPAV are black, and positive samples are coloured and sized according to the virus copy number. A small degree of random noise was added to the latitude and longitude to prevent overplotting.