. 2019 Aug 12;8:e49574. doi: 10.7554/eLife.49574

Figure 1. Effects of disruption of NPF neurons and the npf gene on male courtship.

(A and B) Effects of silencing NPF neurons with Shits (npf-Gal4/+;UAS-Shits/+) on courtship of group-housed male flies towards female targets. Male-female (M–F) courtship was assayed at the permissive (23°C) and non-permissive (31 °C) temperatures for Shits. (A) The percentages of males that initiated courtship. n = 4 (6 flies/group). (B) Courtship index (ratio of time that a male fly exhibits courtship behavior out of the total observation time) scored from 20 to 30 min observation time during a 30 min incubation period, n = 24. (C) Silencing NPF neurons with Shits (npf-Gal4/+;UAS-Shits/+) induces male-male (M–M) courtship. Isolation-housed males were assayed for chaining behavior at 23°C and 31°C for 10 min. n = 6 (8—12 flies/group). The chaining index is the proportion of time that ≥ 3 tester males engage in courtship simultaneously out of a 10 min observation time. The bars indicate means ± SEMs. To determine significance, we used the Mann-Whitney test. *p < 0.05, **p < 0.01, ***p < 0.001. (D) Schematic illustration of npfLexA knock-in reporter line generated by the CRISPR-HDR method. (E) Schematic illustration of the npf1 allele generated by the CRISPR-NHEJ method. npf1 harbors a single nucleotide deletion in the 2nd position of codon 19. (F) Courtship index of group-housed males towards mature, active females. The control flies are w1118-CS. P[g-npf+] is a transgene encompassing the npf+ genomic region. n = 24. (G) Courtship of isolation-housed males towards Drosophila simulans females. n = 12. (H) Courtship of isolation-housed males towards group-housed w1118 males. n = 19—24. (I) Discrimination of male and female targets by the indicated males. Males of the indicated genotypes were exposed to a decapitated 5 day old male and a decapitated 5 day old virgin female. The preference index indicates the proportion of courtship time directed towards a female target out of the total courtship time in 10 min. A preference index of 1.0 indicates that the male spent 100 % of the time courting the decapitated female. n = 12. (J) Courtship index of group-housed males towards newly-eclosed female targets. n = 24. (K) Courtship of group-housed males towards decapitated female targets. n = 20—22. The bars indicate means ± SEMs. The Kruskal-Wallis test followed by the Dunn’s post hoc test was used to assess significance. *p < 0.05, **p < 0.01, ***p < 0.001.

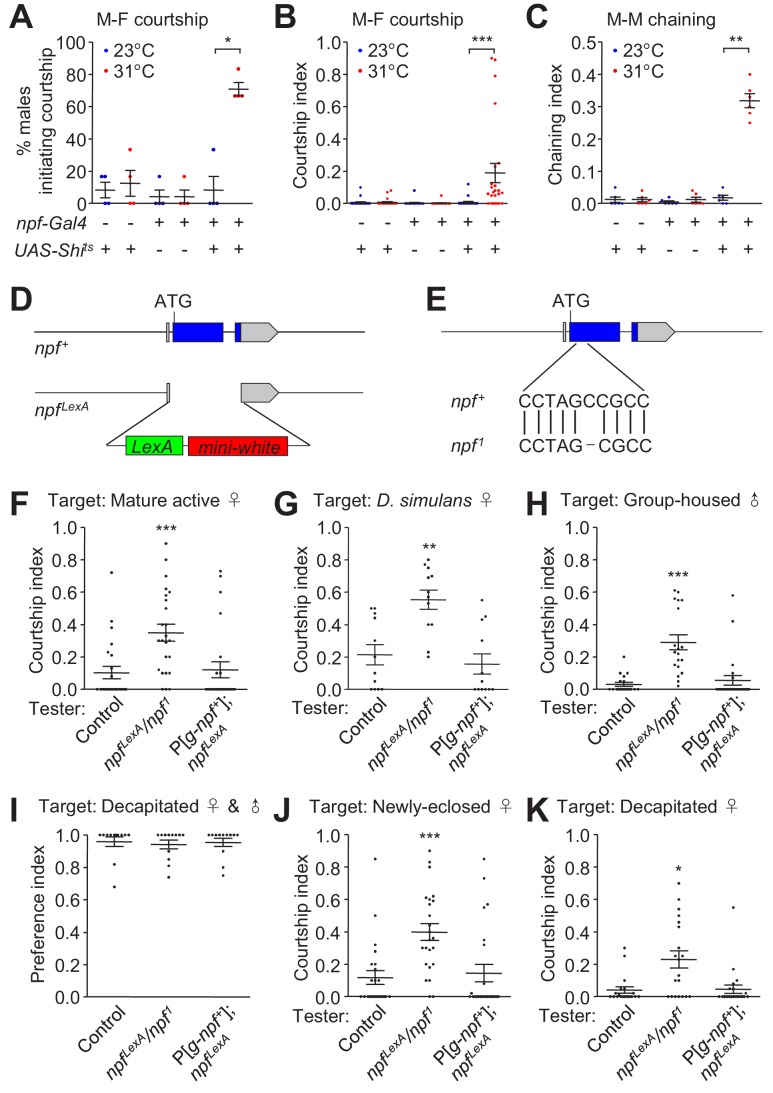
Figure 1—source data 1. Figure 1A—C Source data.
DOI: 10.7554/eLife.49574.014
Figure 1—source data 2. Figure 1A—C Summary statistics.
DOI: 10.7554/eLife.49574.015
Figure 1—source data 3. Figure 1F—K Source data.
DOI: 10.7554/eLife.49574.016
Figure 1—source data 4. Figure 1F—K Summary statistics.
DOI: 10.7554/eLife.49574.017

Figure 1.

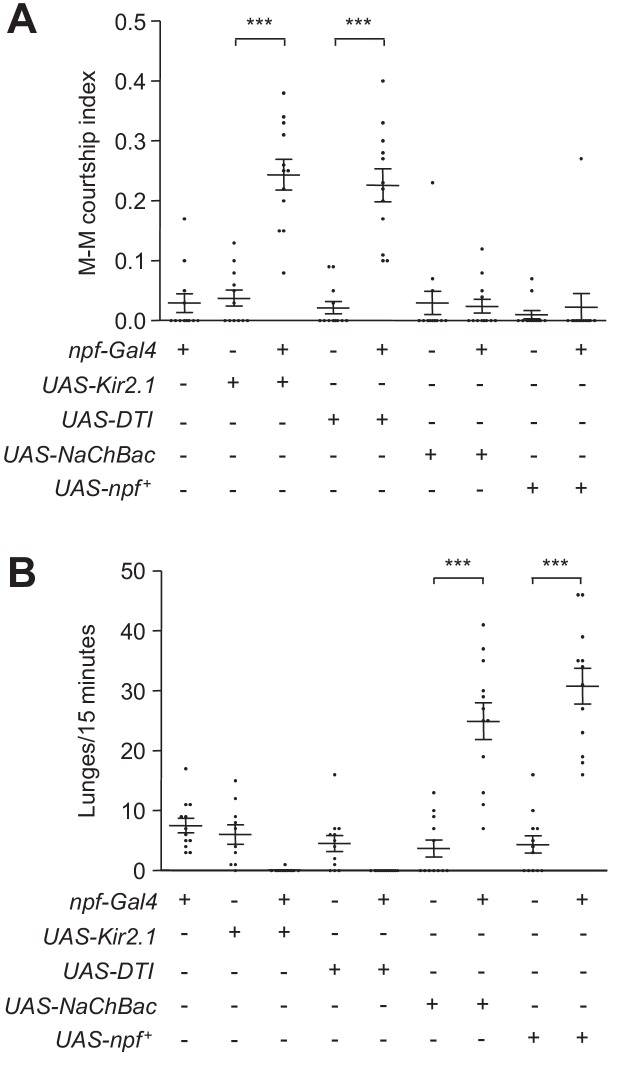
Figure 1—figure supplement 1. Effects of increasing or decreasing NPF signaling on male-male (M–M) courtship and aggression.

Figure 1—figure supplement 1.

(A) Single tester males of the indicated genotypes were assayed for M–M courtship. Single group-housed w1118 males were used as the targets. n = 12. (B) Tester males of the indicated genotypes were assayed for aggression. Lunges over the course of 15 min were scored. Group-housed w1118 males were used as the targets. n = 10—12. The bars indicate means ± SEMs. Significance was assessed using the Mann-Whitney test. ***p < 0.001.
Figure 1—figure supplement 1—source data 1. Figure 1—figure supplement 1A Source data.
DOI: 10.7554/eLife.49574.004
Figure 1—figure supplement 1—source data 2. Figure 1—figure supplement 1A Summary statistics.
DOI: 10.7554/eLife.49574.005
Figure 1—figure supplement 1—source data 3. Figure 1—figure supplement 1B Source data.
DOI: 10.7554/eLife.49574.006
Figure 1—figure supplement 1—source data 4. Figure 1—figure supplement 1B Summary statistics.
DOI: 10.7554/eLife.49574.007
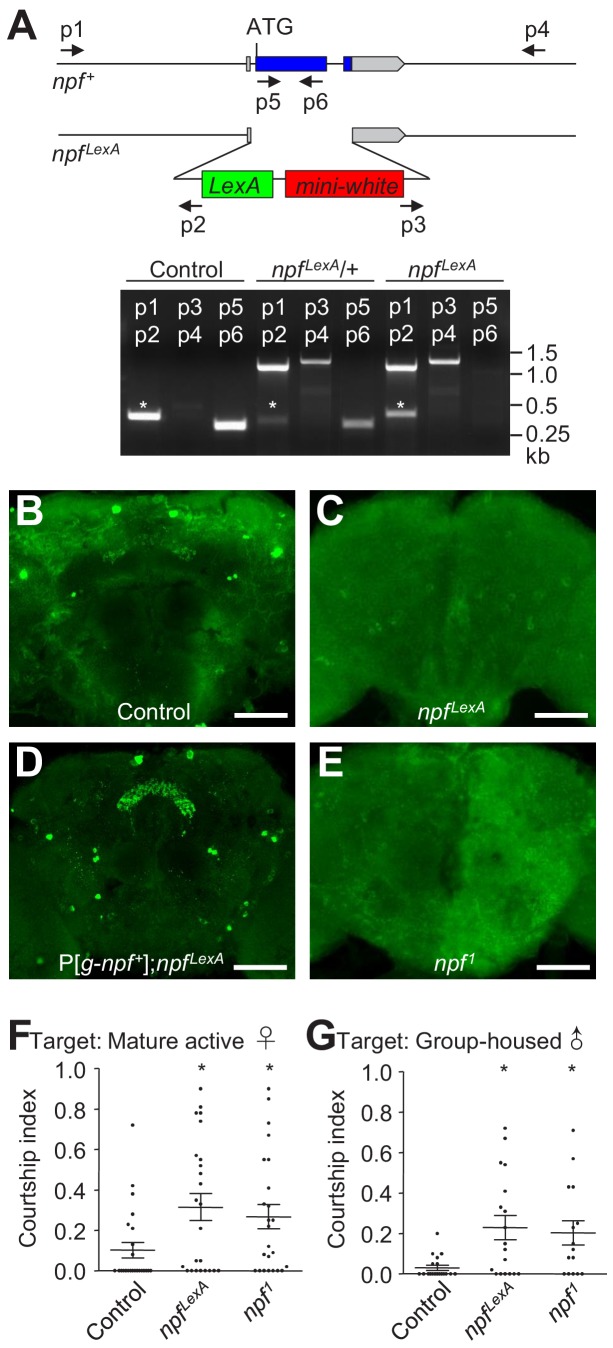
Figure 1—figure supplement 2. Genotyping, testing for NPF expression, and courtship assays using the npf1 and npfLexA mutants.

Figure 1—figure supplement 2.

(A) Schematic showing the npfLexA knock-in reporter/mutant line generated using CRISPR-HDR. Shown below is the genotyping employing the indicated primer pairs, which confirms the integration of LexA and the mini-white coding sequences and disruption of the endogenous npf gene. The stars indicate non-specific bands generated in the control (w1118-CS) and npfLexA during the PCR amplification. (B—E) npfLexA, npf1, P[g-npf+];npfLexA and control male brains stained with anti-NPF. The scale bars represent 50 μm. (F) Group-housed npf1 and npfLexA males were assayed for courtship towards mature active female targets. n = 24. (G) Isolation-housed npf1 and npfLexA mutants were assayed for male-male (M–M) courtship. n = 15—19. The bars indicate means ± SEMs. The Kruskal-Wallis test followed by Dunn’s post hoc test was used to assess significance. *p < 0.05.
Figure 1—figure supplement 2—source data 1. Figure 1—figure supplement 2F Source data.
DOI: 10.7554/eLife.49574.009
Figure 1—figure supplement 2—source data 2. Figure 1—figure supplement 2F Source data.
DOI: 10.7554/eLife.49574.010
Figure 1—figure supplement 2—source data 3. Figure 1—figure supplement 2G Source data.
DOI: 10.7554/eLife.49574.011
Figure 1—figure supplement 2—source data 4. Figure 1—figure supplement 2G Summary statistics.
DOI: 10.7554/eLife.49574.012
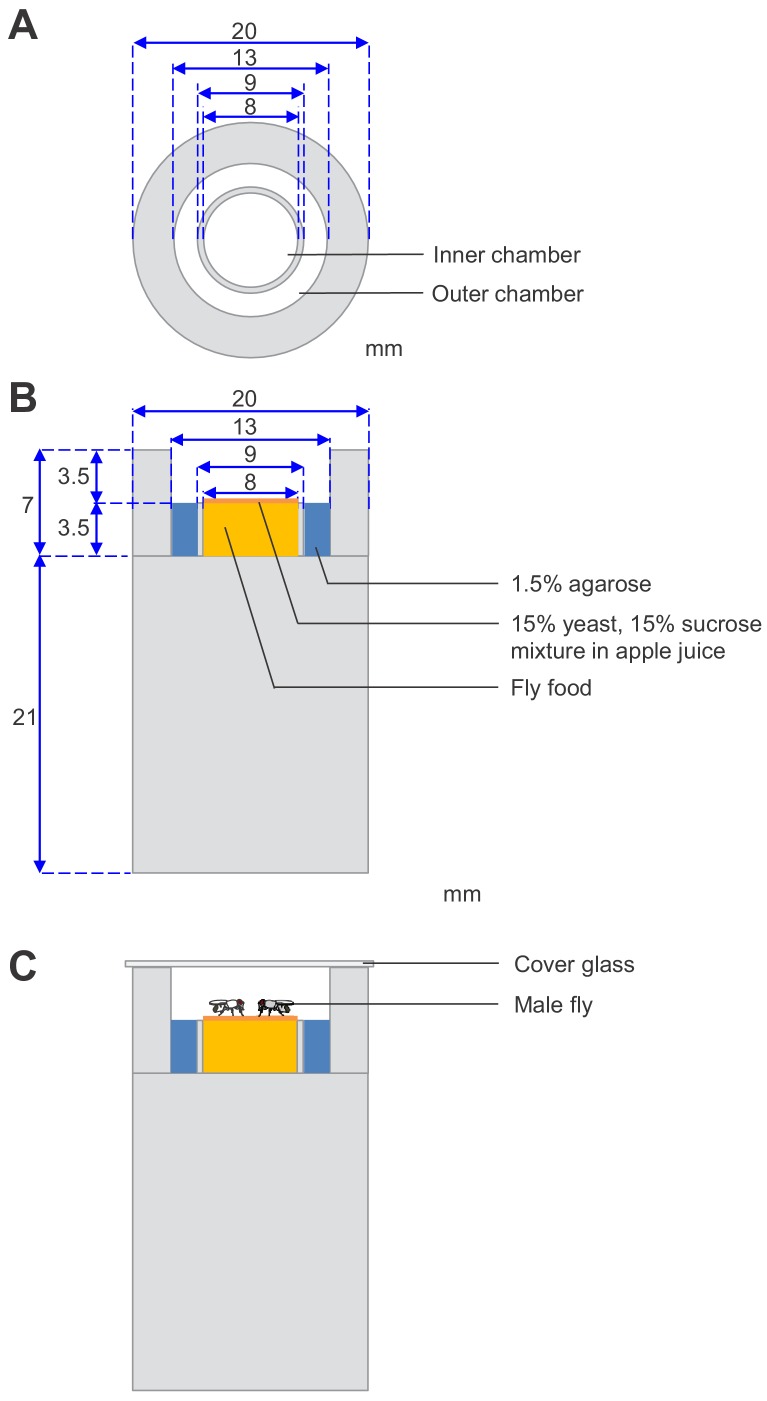
Figure 1—figure supplement 3. Illustration of the aggression chamber.

Figure 1—figure supplement 3.

(A) Top view of the aggression chamber. (B) Side view of the aggression chamber. The numbers indicate the dimensions in mm. (C) Side view of the chamber with slide cover and addition of two males.