. 2019 Aug 21;8:e46112. doi: 10.7554/eLife.46112

Figure 9. AS69 inhibits lipid-induced aggregation of α-synuclein.

(a) Schematic representation of lipid-induced aggregation (Galvagnion et al., 2015). (b) Change in ThT fluorescence intensity when a 70 μM solution of monomeric α-synuclein was incubated with 100 μM DMPS-SUVs and increasing concentrations of AS69 in 20 mM phosphate buffer (pH 6.5) under quiescent conditions. (c) Relative rate of lipid-induced formation of α-synuclein amyloid fibrils as a function of the concentration of AS69. The solid line corresponds to a simulation based on the assumption that AS69 acts only through monomer sequestration (see Appendix 3 for details).

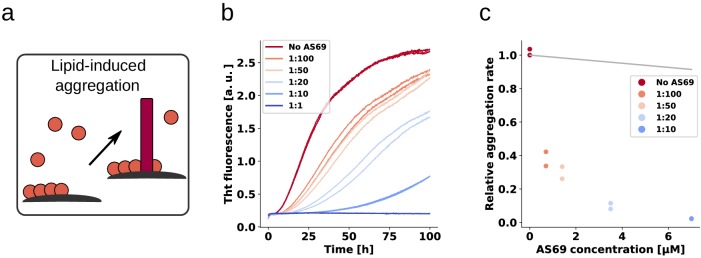
Figure 9.

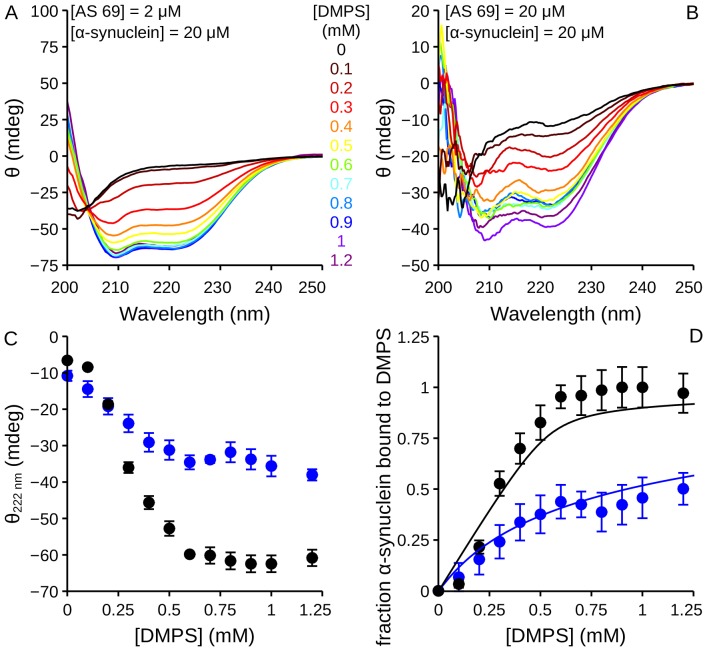
Figure 9—figure supplement 1. Influence of AS69 on the lipid-binding of α-synuclein monitored using circular dichroism.

Figure 9—figure supplement 1.

(a), (b) CD spectra of α-synuclein (20 μM) in the presence of increasing concentrations of DMPS and 2 (a) or 20 (b) μM AS69. (c) Change in the CD signal of α-synuclein measured at 222 nm when the protein was incubated in the presence of 2 (black dots) or 20 (blue dots) μM AS69 and increasing concentrations of DMPS. (d) Change in the fraction of α-synuclein bound to DMPS vesicles in the presence of 2 (black dots) or 20 (blue dots) μM AS69. The solid lines correspond to predictions of the fraction of bound protein calculated using a competitive binding model with the binding constants previously determined for the systems DMPS:α-synuclein (Galvagnion et al., 2015) and AS69:α-synuclein (Mirecka et al., 2014).
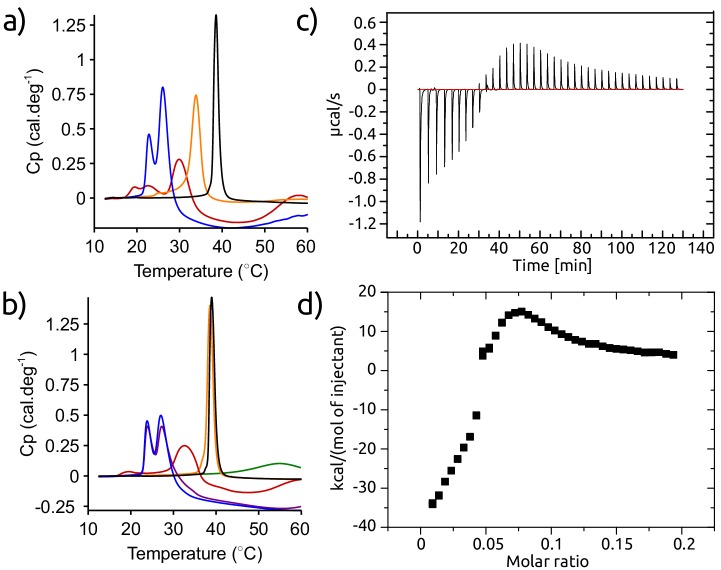
Figure 9—figure supplement 2. Calorimetric experiments designed to elucidate the molecular mechanism of inhibition of lipid-induced aggregation of α-synuclein by AS69.

Figure 9—figure supplement 2.

(a) DSC thermographs of 1 mM DMPS incubated in the absence (black) and the presence of 50 μM α-synuclein (blue), 50 μM AS69 (orange) or 50 μM α-synuclein and 50 μM AS69 (red). (b) Differential scanning calorimetry (DSC) thermographs of 1 mM DMPS incubated in the absence (black) or the presence of 33 μM α-synuclein (blue), 33 μM α-synuclein and 3.3 μM AS69 (purple), 33 μM α-synuclein and 33 μM AS69 (red) or 3.3 μM AS69 (orange). The green curve corresponds to the DSC thermograph of the mixture 33 μM α-synuclein and 33 μM AS69 (red). (c), (d) Isothermal titration calorimetry (ITC) experiments, in which a solution of 0.47 mM AS69 was titrated into 0.5 mM DMPS in 20 mM phosphate buffer pH 6.5 at 30°C, corresponding to the conditions under which the lipid-induced aggregation of α-synuclein had been studied. These ITC experiments provide a direct confirmation of the binding of AS69 to lipid vesicles. The binding behaviour is complex and corresponds to more than one type of interaction. Therefore it is not straightforward to determine the binding affinity from these data.