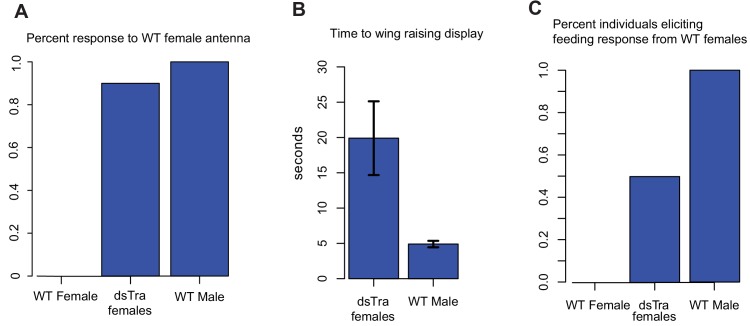
Figure 4. dsBgTra females perform male courtship behavior and elicit courtship responses from wild-type females.
In courtship, wild type male Blattella germanica raise their wings to display their tergal gland. When courtship is successful, wild type females feed upon the secretions of this gland prior to copulation. dsBgTra females (n = 10), wild-type females (n = 10), and wild-type males (n = 10) were exposed to an antenna clipped from a wild-type, 7 day old virgin female, and their response times in seconds were compared. (A) Nine out of ten dsBgTra females performed the stereotypical male wing-raising courtship display in response to a female antenna compared to 0/10 of wild-type females within the one minute of observation time. (B) However, dsBgTra females took longer than wild-type males to respond with the wing-raising display. Wild-type females did not respond to the stimulus throughout the duration of the one-minute observation time. (C) 5/10 dsBgTra females elicited feeding response from wild-type females after raising their wings. Wild-type females, lacking tergal glands, do not elicit a feeding response from other wild-type females.


