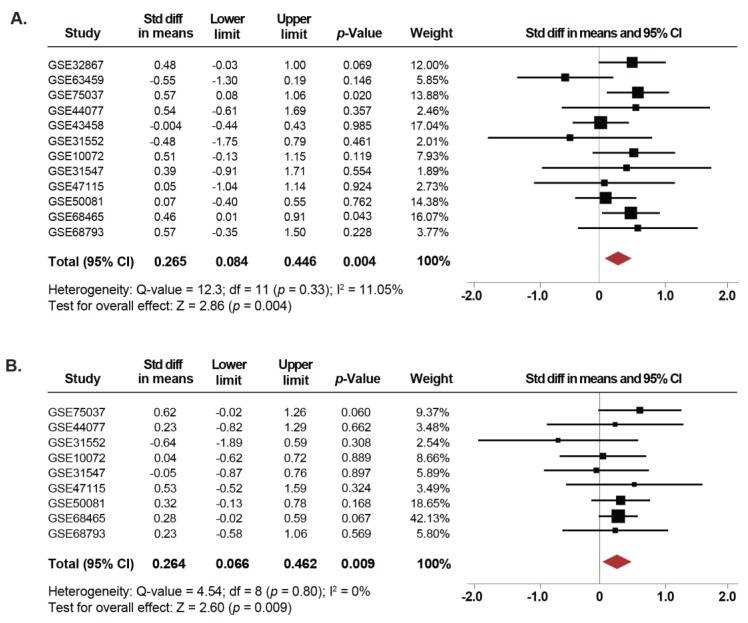
Figure 3.
Upregulation of SETDB1 mRNA is correlated with smoking history. (A) Forest plot of overall analysis of SETDB1 mRNA expressions between NSCLC patients reported as current smokers compared to non-smoker patients. (B) Forest plot of overall analysis of SETDB1 mRNA expressions between NSCLC patients reported as former smokers compared to non-smoker patients. Standardized mean differences (SMD) for each dataset are represented by the squares, and the horizontal line crossing the square represents the 95% CI. The diamonds represent the estimated overall effect.

