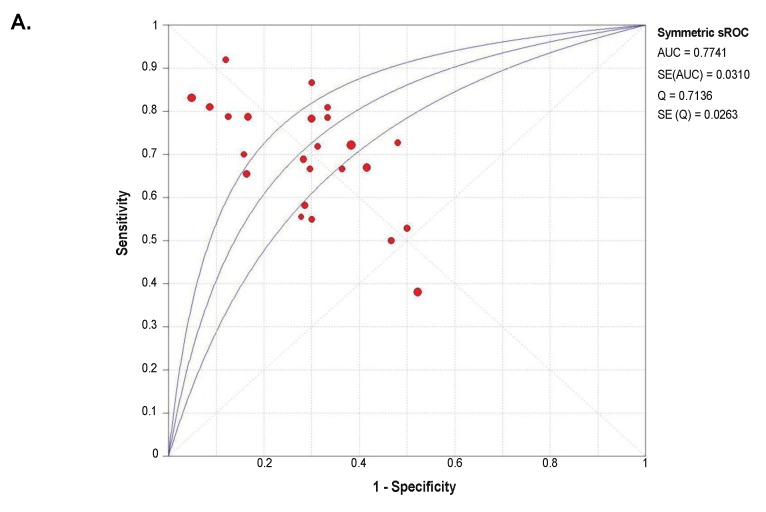
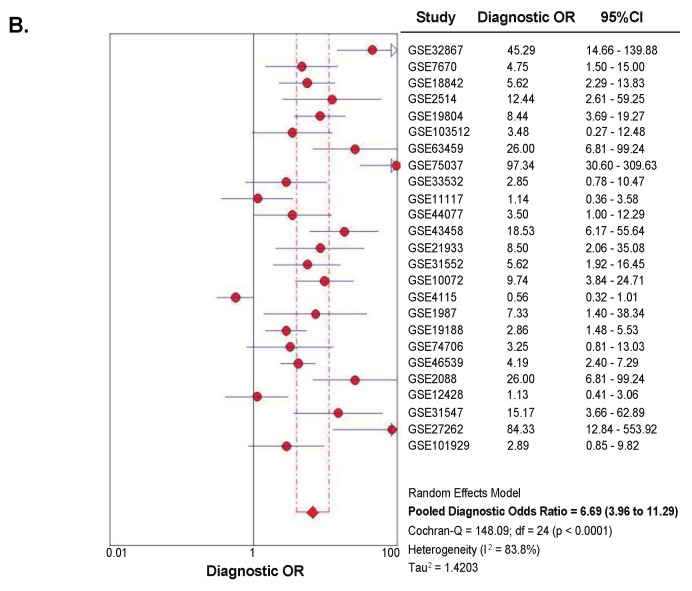
Figure 4.
Summary receiver operator characteristic curve (sROC) and diagnostic odds ratio (OR), showing a moderate discriminative yield of SETDB1 mRNA expression for NSCLC. (A) Symmetrical summary receiver operator characteristic curve (sROC) based on 1140 NSCLC tissues and 952 non-cancerous tissues (25 GEO datasets). The size of the circle symbolizes the sample size of each study included in the meta-analysis. (B) Forest plot for diagnostic odds ratios in NSCLC diagnosis. The circles represent odds ratios for each dataset. The diamond represents the estimated overall effect, based on the meta-analysis random-effect method.


