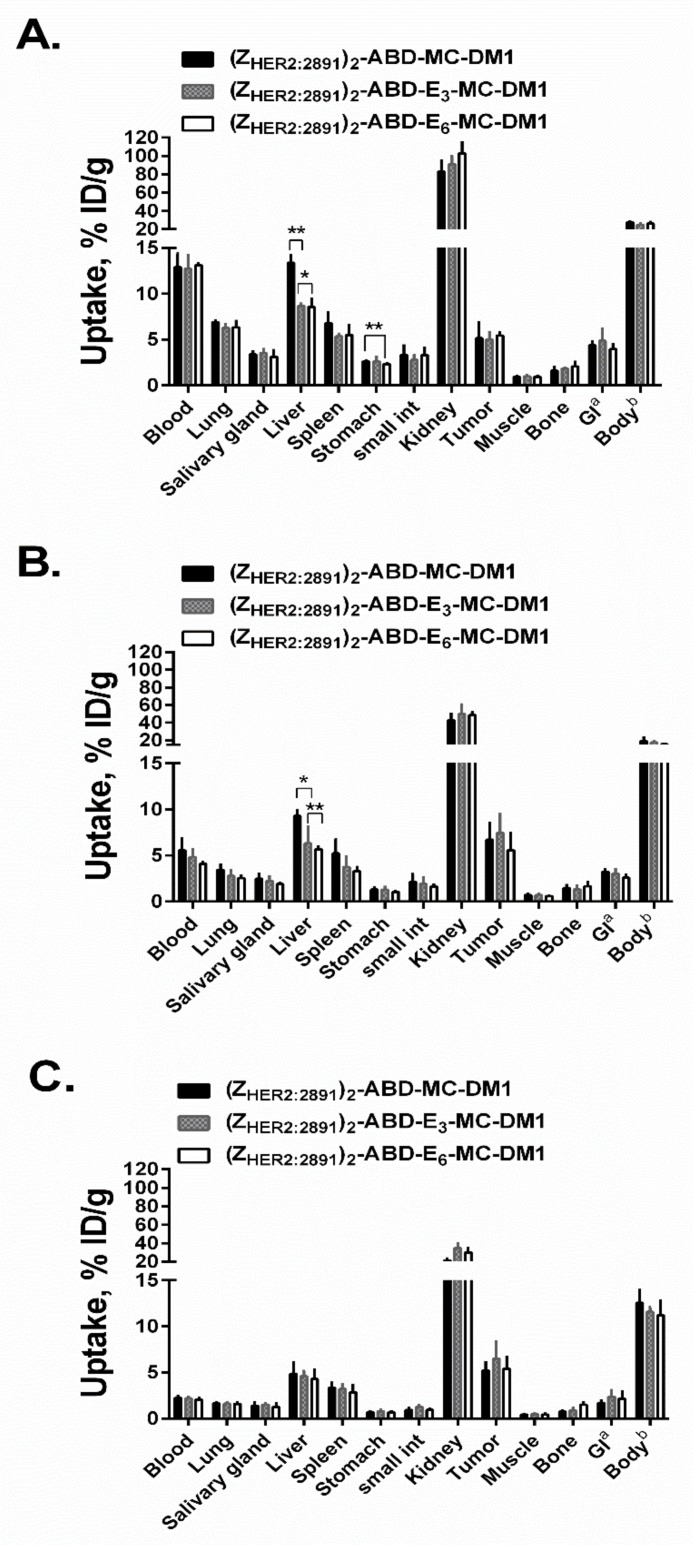
Figure 7.
In vivo biodistribution. Comparative biodistribution of 99mTc-labeled DM1 conjugates expressed as % ID/g and presented as an average value from 4 animals ± 1 SD at 4 (A), 24 (B), and 46 (C) h post i.v. injection in female BALB/c nude mice bearing SKOV-3 xenografts. a,b Data are presented as % ID per whole sample. Data were assessed by one-way ANOVA with Bonferroni’s post hoc multiple comparisons test in order to determine significant differences between groups (p < 0.05) at the same timepoint.

