Figure 7.
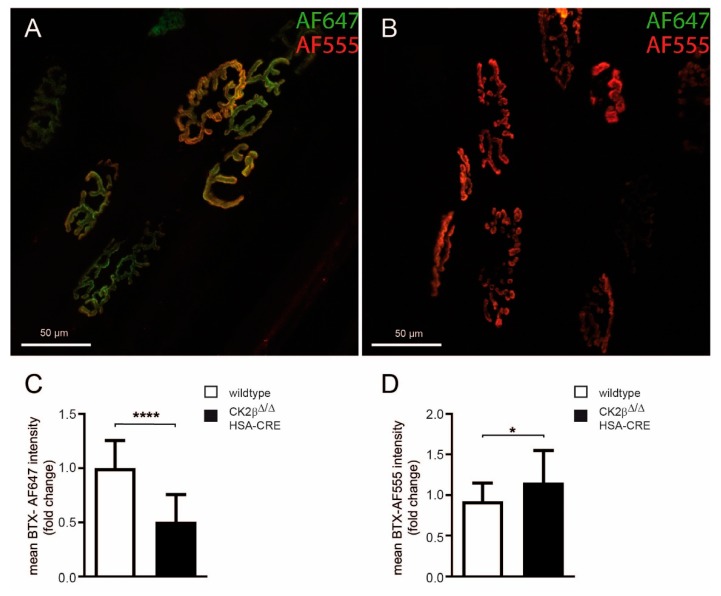
NMJs became fragmented and showed a high turnover of AChRs in CK2β-deficient muscles. (A,B) In vivo microscopy and analysis of AChR turnover and NMJ fragmentation in soleus muscle of control (A) and conditional CK2β-deficient (B) mice. TA muscles of 6–9 months old control and conditional CK2β-deficient mice were studied. Simultaneously, muscles were locally injected with BTX-AF647. Ten days later, muscles were locally injected with BTX-AF555 and then imaged using in vivo confocal microscopy. Maximum z-projections of 45 (CK2β-deficient, B) and 55 (control, A) optical slices were taken at 1.5 µm interslice distance encompassing the entire extensions of shown NMJs in depth. Overlay image, BTX-AF647 (green), BTX-AF555 (red), colocalization (yellow). Scale bar, 50 µm. (C,D) These panels show the comparison of mean intensity of either BTX-AF647 or BTX-AF555 labeled NMJs in control and wild-type and CK2β-deficient muscles. (**** p < 0.0001; * p < 0.05; unpaired two-tailed Student’s t-test; >15 NMJs were analyzed of both control and CK2β-deficient muscles.

