Figure 1.
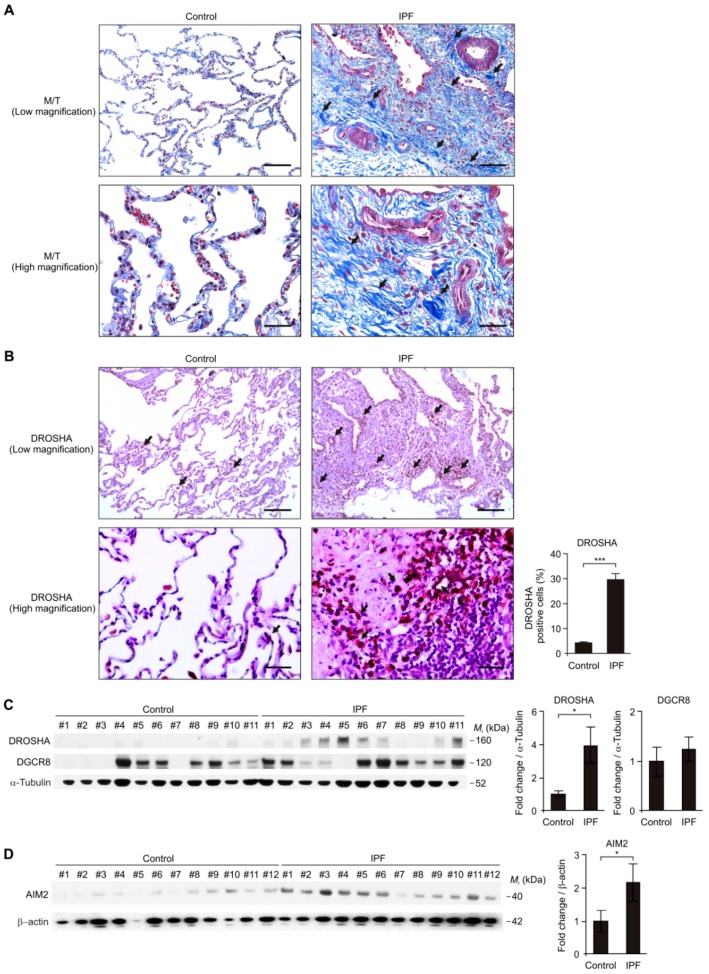
The DROSHA protein levels were elevated in lung tissues of patients with idiopathic pulmonary fibrosis (IPF). (A) Representative immunohistochemistry image of fibrosis by Masson’s trichrome (M/T) staining in lung tissues from patients with IPF (IPF) or non-IPF patients (Control). Positive area and cells are indicated by black arrow. In the low magnification image (top), scale bars are 200 μm. In the high magnification image (bottom) scale, bars are 50 μm. Results are representative of three independent experiments. (B) Representative immunohistochemistry image (left) of DROSHA and quantification of DROSHA-positive cells (the percent of DROSHA-positive cells in total 100 cells in 10 individual images per group) (right) in lung tissues from patients with IPF (IPF, n = 12) or non-IPF patients (Control, n = 9). Positive area and cells are indicated by a black arrow. In low magnification image (top), scale bars are 200 μm. In high magnification image (bottom) scale, bars are 50 μm. (C) Representative immunoblot analysis for DROSHA and DGCR8 (left) and densitometry quantification of DROSHA and DGCR8 levels (normalized to levels of α-tubulin) (right) from lung tissues from patients with IPF (IPF, n = 11) or non-IPF patients (Control, n = 11). (D) Representative immunoblot analysis for absent in melanoma 2 (AIM2) (left) and densitometry quantification of AIM2 levels (normalized to levels of β-actin) (right) from lung tissues from patients with IPF (IPF, n = 12) or non-IPF patients (Control, n = 12). For immunoblots, α-tubulin or β-actin was used as loading control. Data are representative of three independent experiments. Data are mean ± SEM. *** p <0.001, * p <0.05; by Student’s two-tailed t-test.

