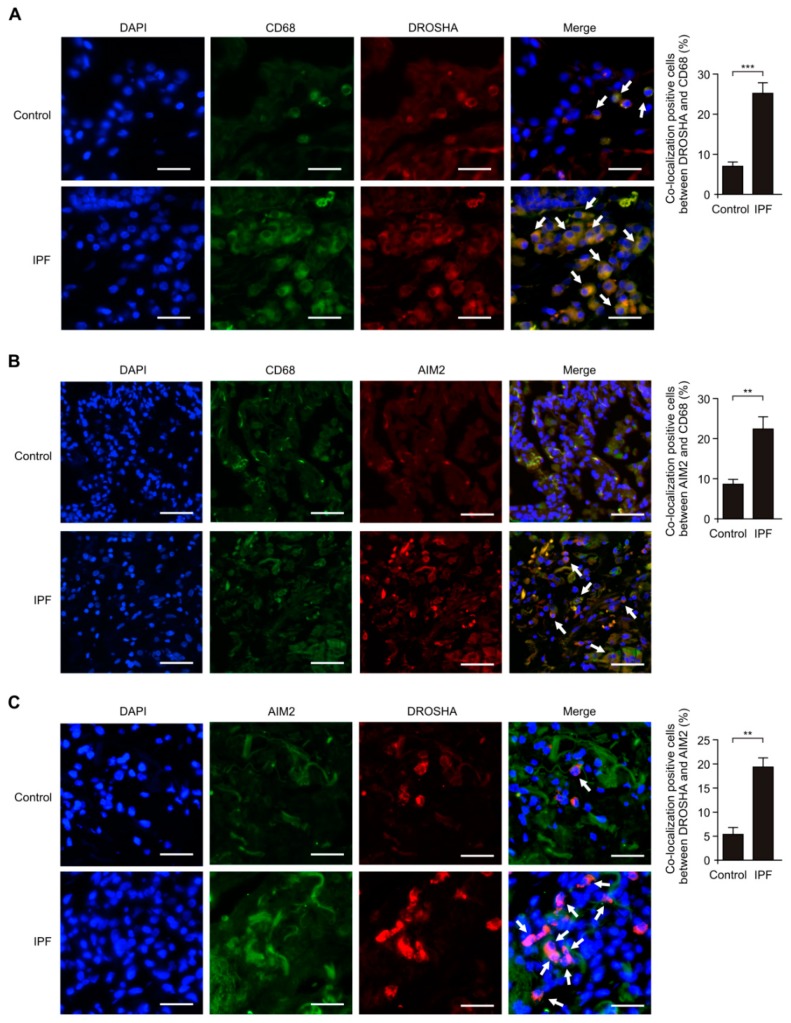
Figure 2.
The DROSHA and AIM2 expression levels were elevated in alveolar macrophages of patients with IPF. (A) Representative immunofluorescence image of CD68 (Green), DROSHA (Red), and DAPI (Blue) staining in lung tissues from patients from IPF (IPF) or healthy subjects (Control). Positive area and cells are indicated by white arrows. Scale bars, 200 μm. Quantification of co-localization positive cells between DROSHA and CD68 (The percent of co-localization positive cells in total 100 cells in 10 individual images per group) (right) in lung tissues from patients with IPF (IPF, n = 5) or non-IPF patients (Control, n = 5). (B) Representative immunofluorescence image of CD68 (Green), AIM2 (Red) and DAPI (Blue) staining in lung tissues from patients with IPF or non-IPF patients (Control). Positive area and cells are indicated by white arrows. Scale bars, 200 μm. Quantification of co-localization positive cells between AIM2 and CD68 (the percent of co-localization positive cells in total 100 cells in 10 individual images per group) (right) in lung tissues from patients with IPF (IPF, n = 5) or non-IPF patients (Control, n = 5). (C) Representative immunofluorescence image of AIM2 (Green), DROSHA (Red), and DAPI (Blue) staining in lung tissues from patients with IPF or non-IPF patients (Control). Positive area and cells are indicated by white arrows. Scale bars, 200 μm. Quantification of co-localization positive cells between DROSHA and AIM2 (the percent of co-localization positive cells in total 100 cells in 10 individual images per group) (right) in lung tissues from patients with IPF (IPF, n = 3) or non-IPF patients (Control, n = 3). Data are mean ± SEM. *** p <0.001, ** p <0.01; by Student’s two-tailed t-test.

