
Figure 2.
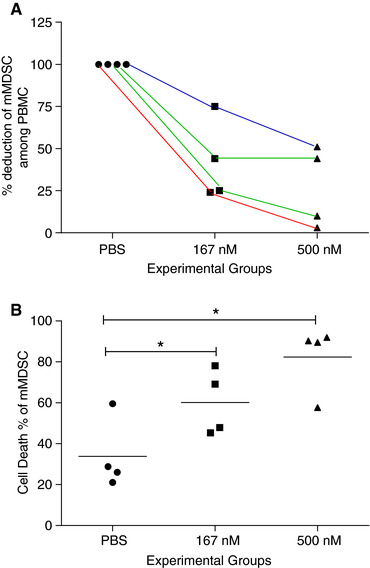
Motolimod treatment initiates apoptosis of mMDSC in cancer patients. (A) Percentage deduction of mMDSC among PBMCs in patients treated with 167 nM and 500 nM motolimod as compared to PBS control. Each line represents data from the same patient at varying doses. Red line: melanoma; green lines: colon cancer; blue line, prostate cancer. (B) Cell death percentage of mMDSC from above 4 patients. Lines are the means of each experimental group. *P < 0.05