
Figure 3.
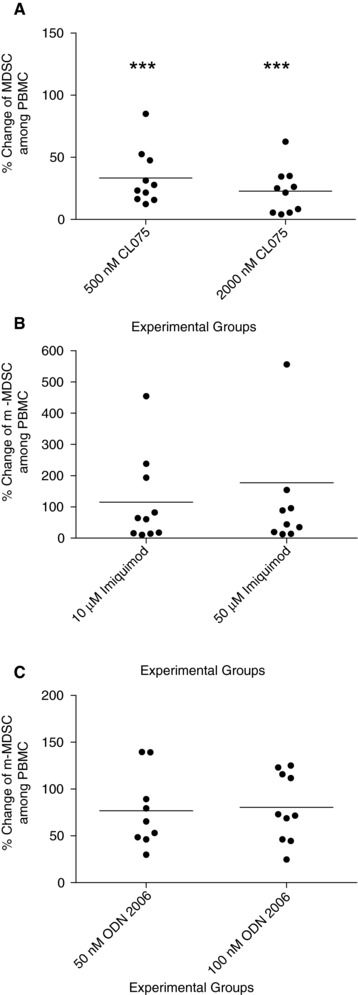
Reduction in mMDSC is specific for treatment with a TLR8 agonist. Percentage change of mMDSC among PBMCs in 0.5 μM and 2 μM CL075 (A), 10 μM and 500 μM Imiquimod (B), and 50 nM and 100 nM ODN 2006 (C) treated PBMC versus PBS controls. Lines are the means of the experimental groups (n = 10 volunteer donors). ***P < 0.000