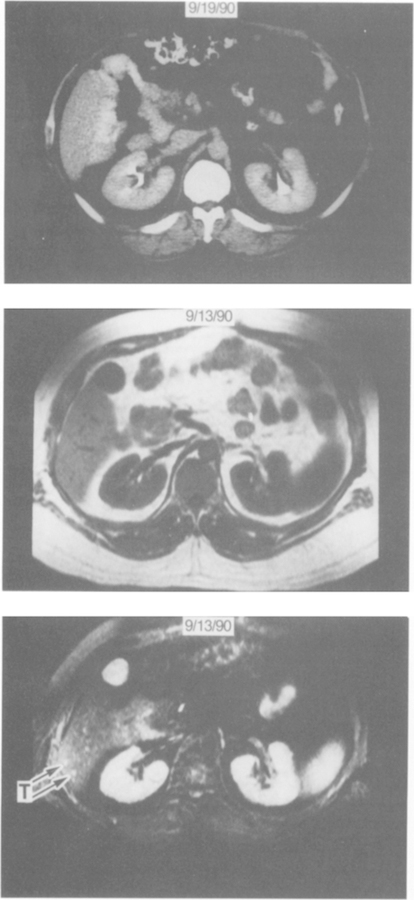
Fig 1.
Comparison of the ability of CT and MR imaging to demonstrate hepatic metastases. CT scan (top panel) of the inferior right hepatic lobe on a bolus-enhanced dynamic scan shows no hepatic lesion. By comparison, the T1 sequence MR imaging (middle panel) shows multiple low-signal-intensity foci within the liver that cannot be distinguished from vessels. The STIR sequence MR imaging (bottom panel) shows multiple foci of high signal intensity (the largest two lesions identified by arrows). Exploratory laparotomy demonstrated multiple small (<1 cm) metastatic gastrinomas throughout both the right and left hepatic lobes.

