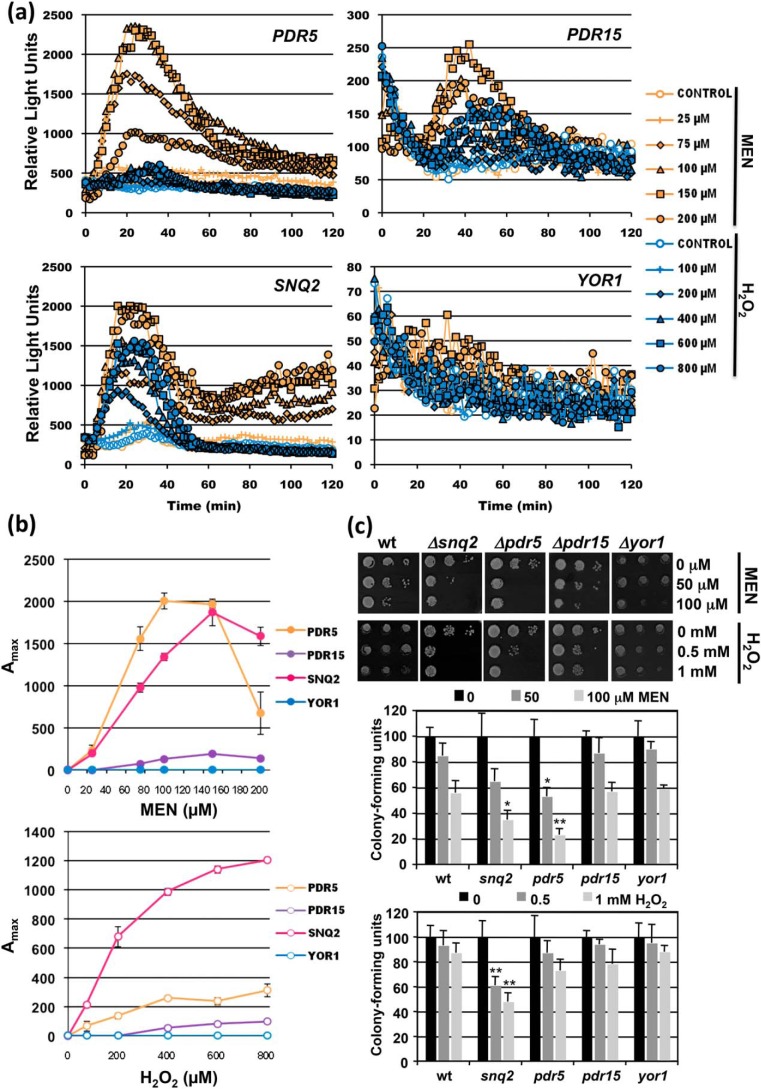
Figure 2.
Real-time gene induction patterns upon MEN and H2O2 exposure. The same yeast strains as in Fig. 1 were used. a, dose response profiles of PDR5, PDR15, SNQ2, and YOR1 upon the treatment with the indicated menadione or H2O2 concentrations. The light emission from three independent culture aliquots was continuously measured. S.D. was <15% throughout the experiment but is not included in the graphs. b, comparison of the sensitivity of gene induction of the same four reporter genes. Shown are the mean values of three independent measurements including S.D. c, sensitivity assays of the indicated transporter mutants. Cells were treated in liquid culture aliquots with the indicated MEN and H2O2 concentrations. Cell growth was then assayed on YPD plates (upper panel) and cfu determined (lower panel). Significant differences according to the Student's t test are marked (*, p < 0.05; **, p < 0.01).

