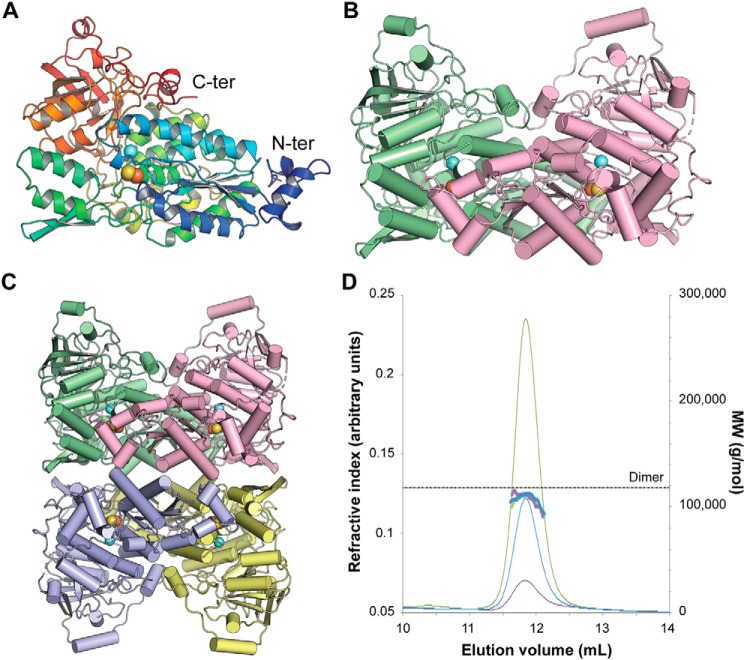
Figure 3.
Three-dimensional structure of Mtb-DHAD. A, the DHAD monomer in rainbow colors from the N terminus (blue) to the C terminus (red). The orange and yellow spheres show the location of the 2Fe–2S cluster, and the blue sphere shows the nearby Mg2+ ion. B, the DHAD dimer (monomers in green and magenta, respectively), showing how the N-terminal subdomain of each monomer sits over the top of the active site of the other monomer (shown by the spheres of the 2Fe–2S cluster and the Mg2+). C, the tetramer seen in the crystal, a dimer of dimers. Each subunit is shown in a different color. D, SEC–multiangle light scattering analysis of Mtb-DHAD. SEC trace of Mtb-DHAD, showing the refractive index (thin lines) and mass average molecular weight (thick lines) data. The left vertical axis refers to the refractive index trace shown for three different protein concentrations (6.0 mg·ml−1 in green, 3.0 mg·ml−1 in blue, and 1.5 mg·ml−1 in purple). The right vertical axis and dotted line show the expected molecular mass of the dimeric form of Mtb-DHAD to be 118 kDa, calculated from the protein sequence.

